intel Inspector Get Dynamic Memory and Threading Error Checking Tool
![]()
Get Started with Intel® Inspector
Intel® Inspector is a dynamic memory and threading error checking tool for users developing serial and multithreaded applications on Windows* and Linux* operating systems.
This document summarizes the typical workflow to get started using the Intel Inspector GUI.
Key Features
Intel Inspector offers:
- Standalone GUI, Microsoft Visual Studio* plug-in, and command line operational environments.
- Preset analysis configurations (with some configurable settings), as well as the ability to create custom analysis configurations to help you control analysis scope and cost.
- Visibility into individual problems, problem occurrences, and call stack information, with problem prioritization and filtering by inclusion and exclusion to help you focus on items that require your attention.
- Problem suppressions support to help you focus on only those issues that require your attention, including the ability to:
- Create suppression rules based on stacks
- Convert third-party suppression files to the Intel Inspector suppression file format
- Create and edit suppression files in a text editor
- Interactive debugging capability so you can investigate problems more deeply during analysis
- Persistent, propagated problem state information to help you avoid investigating issues over and over again
- A wealth of reported memory errors, including on-demand memory leak detection
- Memory growth measurement to help ensure your application uses no more memory than expected
- Data race, deadlock, lock hierarchy violation, and cross-thread stack access error detection, including error detection on the stack
- Intel® Software Manager to download and install Intel software updates, manage subscription status of installed software, activate serial numbers, and discover the latest news about Intel software (Windows* OS only)
Intel Inspector is available as a standalone installation and as part of the following products:
Notices and Disclaimers
Intel technologies may require enabled hardware, software or service activation.
No product or component can be absolutely secure.
Your costs and results may vary.
© Intel Corporation. Intel, the Intel logo, and other Intel marks are trademarks of Intel Corporation or its subsidiaries. Other names and brands may be claimed as the property of others.
Microsoft, Windows, and the Windows logo are trademarks, or registered trademarks of Microsoft Corporation in the United States and/or other countries.
No license (express or implied, by estoppel or otherwise) to any intellectual property rights is granted by this document.
The products described may contain design defects or errors known as errata which may cause the product to deviate from published specifications. Current characterized errata are available on request.
Intel disclaims all express and implied warranties, including without limitation, the implied warranties of merchantability, fitness for a particular purpose, and non-infringement, as well as any warranty arising from course of performance, course of dealing, or usage in trade.
Get Started with Intel® Inspector-Windows* OS
Intel® Inspector is a dynamic memory and threading error checking tool for users developing serial and multithreaded applications on Windows* and Linux* operating systems. This topic is part of a Getting Started document that summarizes an end-to-end workflow you can apply to your applications.
Prerequisites
You can use the Intel Inspector to analyze memory and threading errors in both debug and release modes of C++ and Fortran binaries. To build applications that produce the most accurate and complete Intel Inspector analysis results:
Build your application in debug mode.
- Use optimal compiler/linker settings. For more information, see Building Applications in Intel Inspector Help.
- Ensure your application creates more than one thread before you run threading analyses. In addition:
- Verify your application runs outside the Intel Inspector environment.
- Run the <inspector-install-dir>\inspxe-vars.bat command. .
The default installation path, <inspector-install-dir>, is below C:\Program Files (x86)\Intel
\oneAPI\inspector (on certain systems, instead of Program Files (x86), the directory name is Program Files ).
NOTE Setting up your environment is necessary only if you plan to use the inspxe-gui command to
launch the Intel Inspector standalone GUI interface or the inspxe-cl command to run the command line interface.
For more information, see Building Applications in Intel Inspector Help.
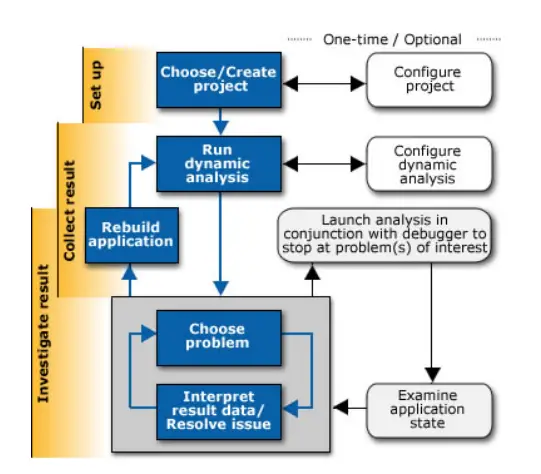
Get Started
Follow these steps to get started using the Intel Inspector.
Launch the Intel Inspector
To launch the:
- Intel Inspector standalone GUI: Run the inspxe-gui command or from the Microsoft Windows* All Apps screen, select Intel Inspector [version].
- Intel Inspector plug-in to the Visual Studio* IDE: Open your solution in the Visual Studio* IDE and click the
 icon.
icon.
To launch the command line interface: Run the inspxe-cl command. (To get help, append -help to the command line.)
Choose/Create Project
Intel Inspector is based on a project paradigm and requires that you create or open a project to enable analysis features.
Think of an analysis project as a:
- Compiled application
- Collection of configurable attributes, including suppression rules and search directories
- Container for analysis results
For more information, see Choosing Projects in Intel Inspector Help.
Configure Project
Data set size and workload have a direct impact on application execution time and analysis speed.
For best results, choose small, representative data sets that create threads with minimal to moderate work per thread.
Your objective: In as short a runtime period as possible, execute as many paths and the maximum number of tasks (parallel activities) as you can afford, while minimizing the redundant computation within each task to the bare minimum needed for good code coverage.
Data sets that run a few seconds are ideal. Create additional data sets to ensure all your code is inspected.
For more information, see Configuring Projects in Intel Inspector Help.
Configure Analysis
Intel Inspector offers a range of preset memory and threading analysis types (as well as custom analysis types) to help you control analysis scope and cost. The narrower the scope, the lighter the load on the system. The wider the scope, the larger the load on the system.
Tip
Use analysis types iteratively. Start with a narrow scope to verify your application is set up correctly and set expectations for analysis duration. Widen the scope only if you need more answers and you can tolerate the increased cost.
For more information, see Configuring Analyses in Intel Inspector Help.
Run Analysis
When you run an analysis, the Intel Inspector:
- Executes your application.
- Identifies issues that may need handling.
- Collects those issues in a result.
- Converts symbol information into filenames and line numbers.
- Applies suppression rules.
- Performs duplicate elimination.
- Forms problem sets.
- Depending on your analysis configuration options, may launch an interactive debugging session. For more information, see Running Analyses in Intel Inspector Help.
Choose Problems
During analysis, the Intel Inspector displays problems in the order detected. After analysis is complete, the Intel Inspector:
- Groups detected problems into problem sets (but still provides visibility into individual problems and problem occurrences).
- Prioritizes the problem sets.
- Offers filtering to help you focus on those problem sets that require your attention.

For more information, see Choosing Problems in Intel Inspector Help.
Interpret Result Data and Resolve Issues
Use the following Intel Inspector features to enhance your productivity:
| Interpret result data. | Explain Problem Help
For more information, see Accessing Explain Problem Help in Intel Inspector Help. |
|
| Focus only on those issues that require your attention. | Severity Levels For more information, see Severity Levels in Intel Inspector Help. |
|
| States | After analysis is complete | |
| For more information, see States in Intel Inspector Help. | ||
| Suppression rules | After analysis is complete | |
| For more information, see Suppressions Support in Intel Inspector Help. | ||
| Resolve issues. | Direct access to a default editor For more information, see Editing Source Code in Intel Inspector Help. |
|
Learn More
| Document/Resource | Description |
| Intel Inspector: Featured Documentation | An excellent overall resource for novice, intermediate, and advanced users, this page includes links to guides, release notes, videos, featured topics, training samples, and more. |
| Intel Inspector Release Notes and New Features | Contain up-to-date information about the Intel Inspector, including a description, technical support, and known limitations. This document also contains system requirements, installation instructions, and instructions for setting up the command line environment. |
| Tutorials | Help you learn to use the Intel Inspector. After you copy a training sample compressed file to a writable directory, use a suitable tool to extract the contents. To load a training sample into the Visual Studio* environment, doubleclickthe.sln file.
Training samples help you learn to use the Intel Inspector. Training samples are installed as individual compressed files under <inspector-install-dir> \samples\en\. After you copy a training sample compressed file to a writable directory, use a suitable tool to extract the contents. Extracted contents include a short README that describes how to build the training sample and fix issues. To load a training sample into the Visual Studio* environment, double-click the .sln file. Tutorials show you how to find and fix uninitialized memory access, memory leak, and data race errors using C++ and Fortran training samples. |
| Intel Inspector User Guide | The User Guide is the primary documentation for the Intel Inspector. |
| More Resources | Intel Inspector: Home Intel Inspector Glossary Explore Our Documentation |
Get Started with Intel® Inspector-Linux* OS
Intel® Inspector is a dynamic memory and threading error checking tool for users developing serial and multithreaded applications on Windows* and Linux* operating systems. This topic is part of a Getting Started document that summarizes an end-to-end workflow you can apply to your applications.
Prerequisites
You can use the Intel Inspector to analyze memory and threading errors in both debug and release modes of C++ and Fortran binaries. To build applications that produce the most accurate and complete Intel Inspector analysis results:
- Build your application in debug mode.
- Use optimal compiler/linker settings. For more information, see Building Applications in Intel Inspector Help.
- Ensure your application creates more than one thread before you run threading analyses. In addition:
- Verify your application runs outside the Intel Inspector environment.
- Ensure you set the EDITOR or VISUAL environment variable to your text editor.
- Do one of the following to set up your environment:
- Run one of the following source commands:
- For csh/tcsh users: source <inspector-install-dir>/inspxe-vars.csh
- For bash users: source <inspector-install-dir>/inspxe-vars.sh
- The name of this script for the application as part of an Intel® oneAPI HPC Toolkit or Intel® oneAPI IoT Toolkit installation is env\vars instead of inspxe-vars.
The default installation path, <inspector-install-dir>, is below: - /opt/intel/oneapi/inspector for root users
- $HOME/intel/oneapi/inspector for non-root users
- Add <inspector-install-dir>/bin32 or <inspector-install-dir>/bin64 to your path.
For more information, see Building Applications in Intel Inspector Help.
Get Started
Follow these steps to get started using the Intel Inspector

Launch the Intel Inspector
To launch the Intel Inspector standalone GUI, run the inspxe-gui command.
To launch the command line interface: Run the inspxe-cl command. (To get help, append -help to the
command line.)
Choose/Create Project Intel Inspector is based on a project paradigm and requires that you create or open a project to enable analysis features.
Think of an analysis project as a:
- Compiled application
- Collection of configurable attributes, including suppression rules and search directories
- Container for analysis results For more information, see Choosing Projects in Intel Inspector Help.
Configure Project
Data set size and workload have a direct impact on application execution time and analysis speed.
For best results, choose small, representative data sets that create threads with minimal to moderate work per thread.
Your objective: In as short a runtime period as possible, execute as many paths and the maximum number of tasks (parallel activities) as you can afford, while minimizing the redundant computation within each task to the bare minimum needed for good code coverage.
Data sets that run a few seconds are ideal. Create additional data sets to ensure all your code is inspected.
For more information, see Configuring Projects in Intel Inspector Help.
Configure Analysis
Intel Inspector offers a range of preset memory and threading analysis types (as well as custom analysis types) to help you control analysis scope and cost. The narrower the scope, the lighter the load on the system. The wider the scope, the larger the load on the system.
Tip
Use analysis types iteratively. Start with a narrow scope to verify your application is set up correctly
and set expectations for analysis duration. Widen the scope only if you need more answers and you can tolerate the increased cost.
For more information, see Configuring Analyses in Intel Inspector Help.
Run Analysis
When you run an analysis, the Intel Inspector:
- Executes your application.
- Identifies issues that may need handling.
- Collects those issues in a result.
- Converts symbol information into filenames and line numbers.
- Applies suppression rules.
- Performs duplicate elimination.
- Forms problem sets.
- Depending on your analysis configuration options, may launch an interactive debugging session.
For more information, see Running Analyses in Intel Inspector Help.
Choose Problems During analysis, the Intel Inspector displays problems in the order detected. After analysis is complete, the Intel Inspector: - Groups detected problems into problem sets (but still provides visibility into individual problems and problem occurrences).
- Prioritizes the problem sets.
- Offers filtering to help you focus on those problem sets that require your attention

For more information, see Choosing Problems in Intel Inspector Help.
Interpret Result Data and Resolve Issues
Use the following Intel Inspector features to enhance your productivity:
| Objective | Feature | During Analysis/After Analysis Is Complete |
| Interpret result data. | Explain Problem Help
For more information, see Accessing Explain Problem Help in Intel Inspector Help. |
|
| Focus only on those issues that require your attention. | Severity Levels For more information, see Severity Levels in Intel Inspector Help. |
|
| States | After analysis is complete | |
| For more information, see States in Intel Inspector Help. | ||
| Suppression rules | After analysis is complete | |
| For more information, see Suppressions Support in Intel Inspector Help. | ||
| Resolve issues. | Direct access to a default editor For more information, see Editing Source Code in Intel Inspector Help. |
|
Learn More
| Document/Resource | Description |
| Intel Inspector: Featured Documentation | An excellent overall resource for novice, intermediate, and advanced users, this page includes links to guides, release notes, videos, featured topics, training samples, and more |
| Intel Inspector Release Notes and New Features | Contain up-to-date information about the Intel Inspector, including a description, technical support, and known limitations. This document also contains system requirements, installation instructions, and instructions for setting up the command line environment.
|
| Tutorials | Help you learn to use the Intel Inspector. After you copy a training sample compressed file to a writable directory, use a suitable tool to extract the contents. To load a training sample into the Visual Studio* environment, double- click the .sln file.
Training samples help you learn to use the Intel Inspector. Training samples are installed as individual compressed files under <inspector-install-dir>/ samples/en/. After you copy a training sample compressed file to a writable directory, use a suitable tool to extract the contents. Extracted contents include a short README that describes how to build the training sample and fix issues. Tutorials show you how to find and fix uninitialized memory access, memory leak, and data race errors using C++ and Fortran training samples.
|
| Intel Inspector User Guide | The User Guide is the primary documentation for the Intel Inspector. |
| Intel Inspector: Home |
![]()
Documents / Resources
 |
intel Inspector Get Dynamic Memory and Threading Error Checking Tool [pdf] User Guide Inspector Get, Dynamic Memory and Threading Error Checking Tool, Inspector Get Dynamic Memory and Threading Error Checking Tool, Threading Error Checking Tool, Error Checking Tool, Checking Tool |