Graphic Controls Trek Tag 4G Cellular Temperature Data Logger
Product overview
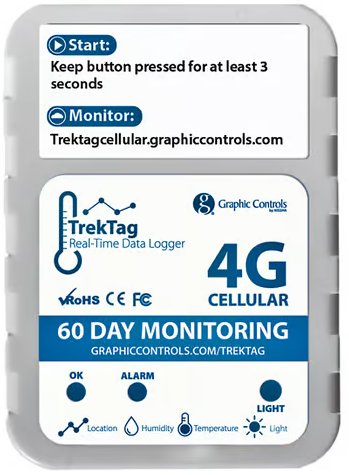
TrekTag 4G Cellular single-use temperature and humidity data logger is designed for the cold chain. Using high-quality sensitive elements, high measurement accuracy, embedded 4G modules, the measured data is sent to the background system by way of the 4G network for monitoring and analysis, and has the functions of alarm, light, positioning, and USB automatically generating PDF reports. TrekTag 4G Cellular uses a low-power work mode. It is awakened only when sending data and operations and is otherwise it is in sleep mode at other times. The long standby time can bring greater convenience. It is suitable for monitoring of transportation processes such as food, medicine, and chemical products, can be used for real-time monitoring, and can also be used for data storage and extraction. It is widely used in all aspects of cold chain logistics, such as refrigerated containers, refrigerated trucks, refrigerated delivery boxes, etc.
Specifications

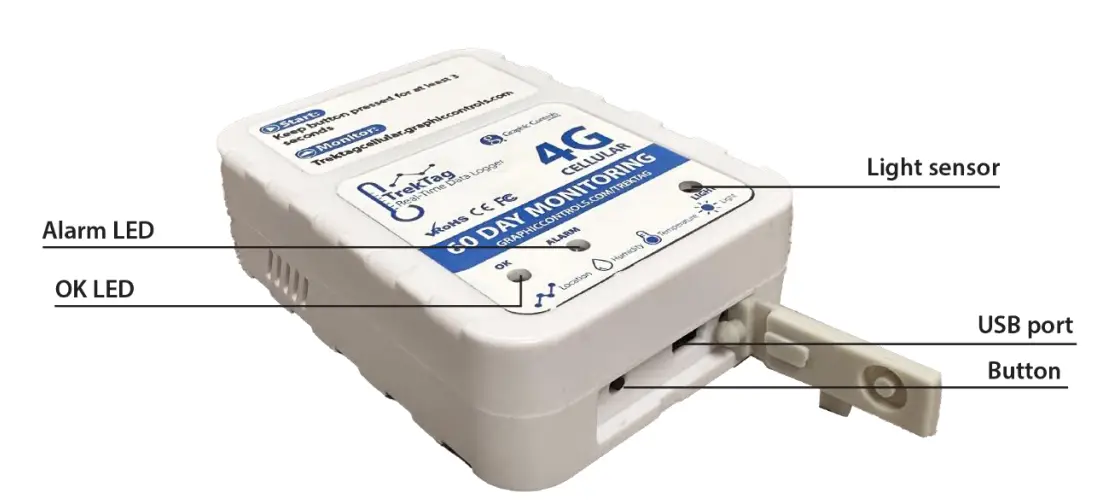
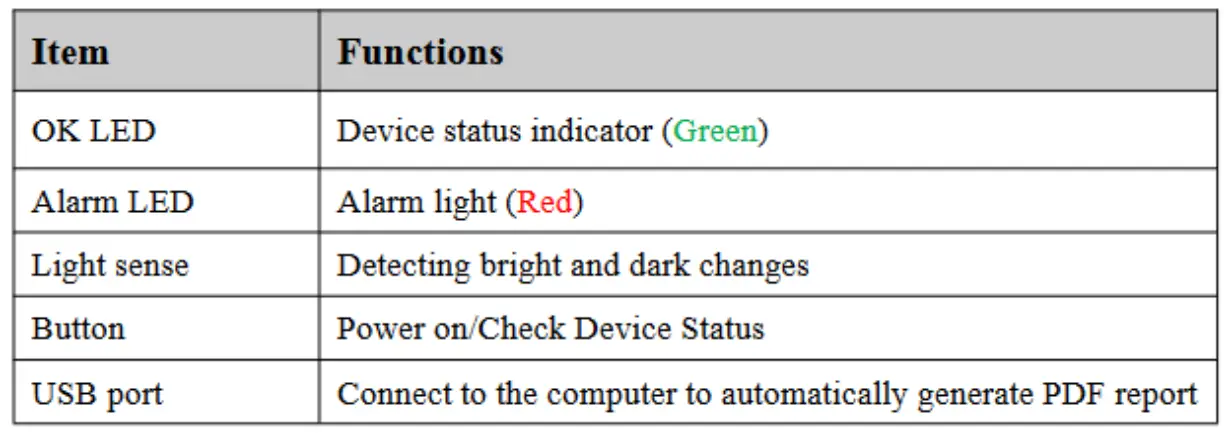
Product Features
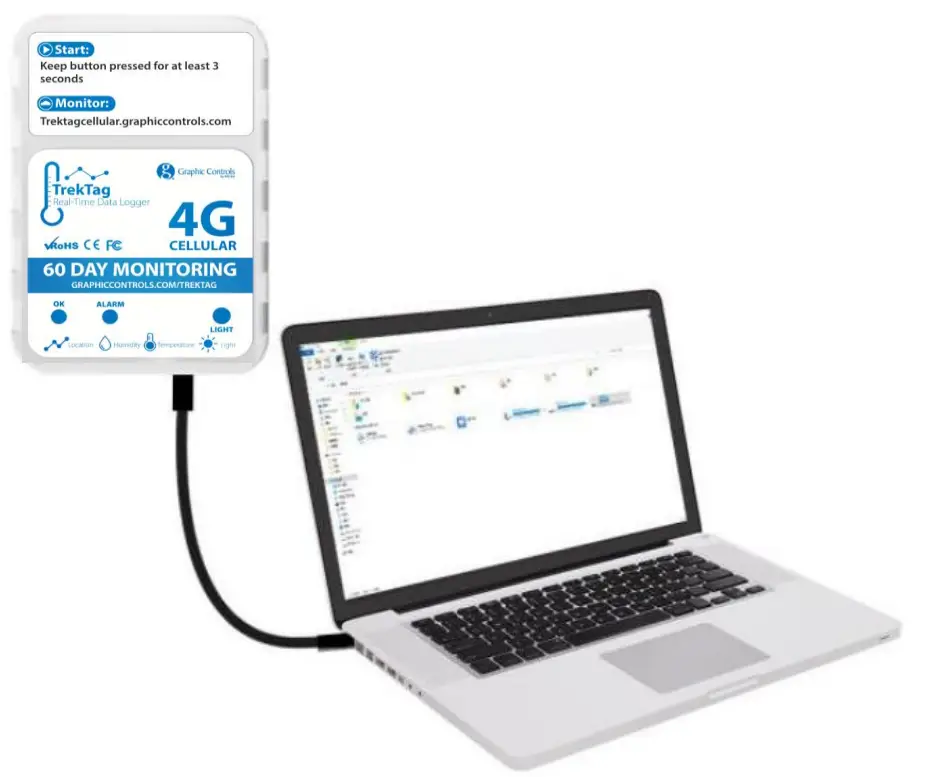
Now that you know more about your TrekTag 4G Cellular unit, it is important to let you know there are 2 different ways to use the logger. The first, simpler way is to simply turn on the logger per the following steps. The logger will take readings every 15 minutes per its default setting and will monitor temperature and humidity at face value readings. Alarm readings would be extreme values. The unit will then be connected by way of USB cable to a computer where a PDF file is automatically generated, providing the information gathered on the shipment. The second, more functional, way to use the logger is to create an account, register the logger unit and be able to track the progress of the shipment in real-time for location, temperature, and humidity, with PDF and Excel reports able to be run while in journey and at journey’s end.
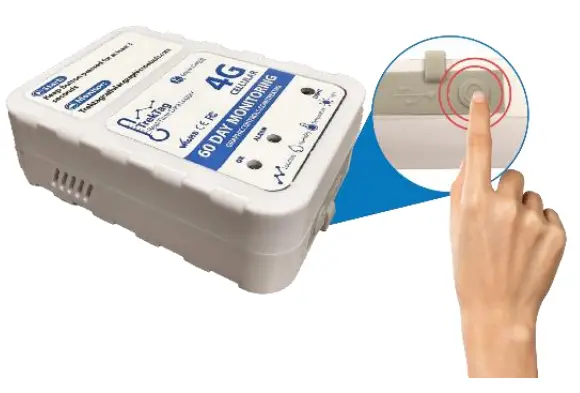
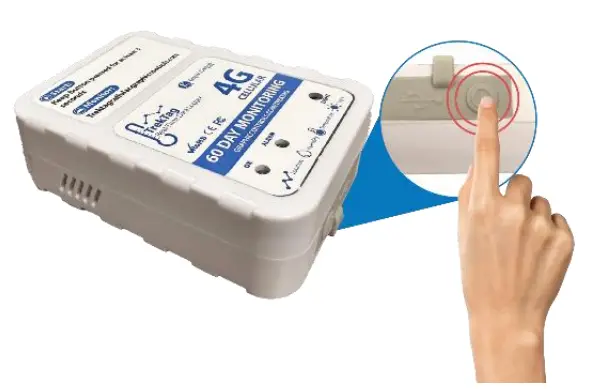
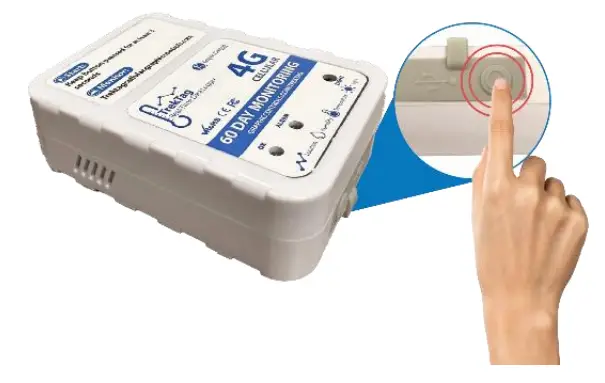
Operation in BASIC MODE
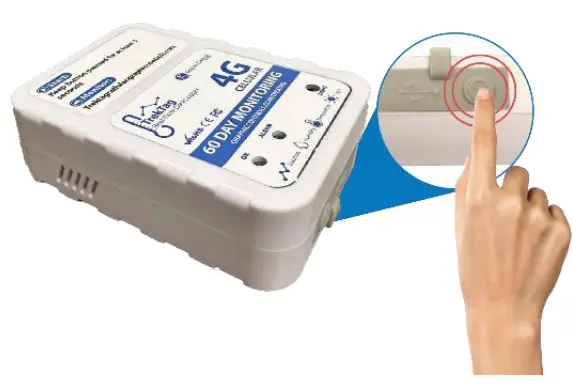
- Turn on the device – Press the “Button” key for a minimum of 3 seconds. Successful start-up will have the green light staying on for 5 seconds. It means that the device has been turned on and data will be sent.
- Normal Operation – After turning the device on, the device will send data according to the pre-set 15-minute interval, and “OK LED” will flash a green light every 10 seconds or press the “Button” key “OK LED” to flash the green light once and “wake up” the device.
- Alarm potential – After the temperature and humidity of the device collection exceed the pre-set alarm range, the device will issue an alarm. “Alarm LED” will flash its red light every 10 seconds or press the “Button” key “Alarm LED” to flash the red light once.
- System Wake-Up or “Mark” – Short press the “Button” key when the device is dormant. The device is awakened and immediately sends a data.
- PDF Report Download – After using a USB cable (not included) to connect the device with a computer, the computer will read the downloaded information and automatically generate a PDF report. If the real-time data of the device cannot be queried, the historical data of the device can be viewed through the PDF report.
Operation in REAL-TIME MODE
UNLESS YOU ARE GOING TO ACTIVATE AND USE YOUR LOGGER IMMEDIATELY, DO NOT TURN ON / ACTIVATE YOUR LOGGER. Most of the set up can be done while the logger is not activated and can be done in advance of shipments.
The true benefit of TrekTag 4G Cellular is the ability to see data in real-time. To see the data properly, an account needs to be set up and the logger needs to be registered through the TrekTag domain. There are 2 ways to connect to the TrekTag Cloud domain.
One – go to your browser and enter https://trektagcellular@graphiccontrols.com
Two – enter the domain through the Graphic Controls website, https://www.dr.graphiccontrols.com and go to the TrekTag Data Loggers page and locating the TrekTag Analytics link:
You will get to the log in screen by using either method: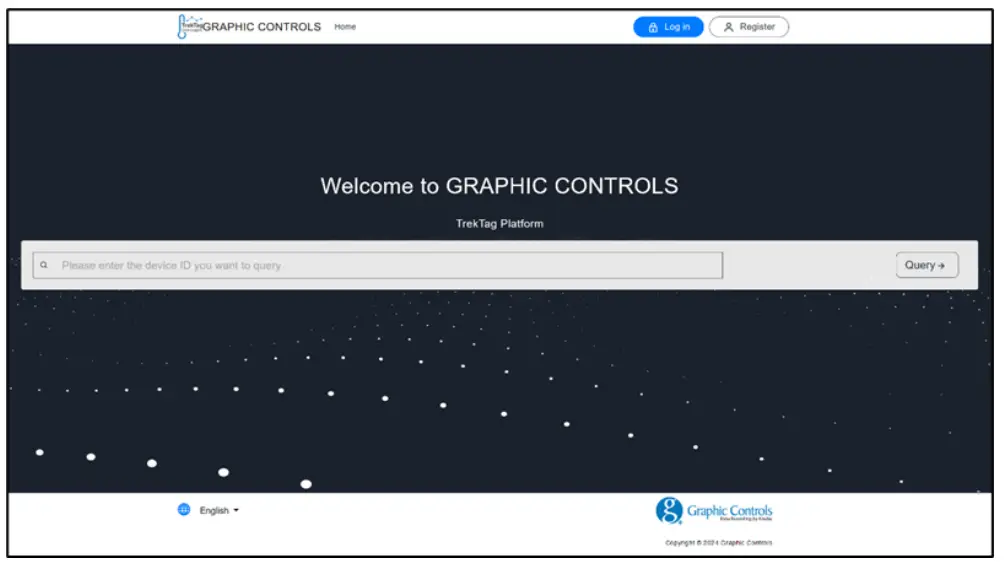
- Register or Log-In – Once at the domain home page you have to sign in to the free software portal used to provide you with your real-time data. Forst time users will need to register. Register with an email and password. Please be careful not to share your information with anyone you do not want to have the information. You will also be able to set up sub-accounts to allow multiple people to view the information captured. Once registered, click the “Log In” button to enter your information.
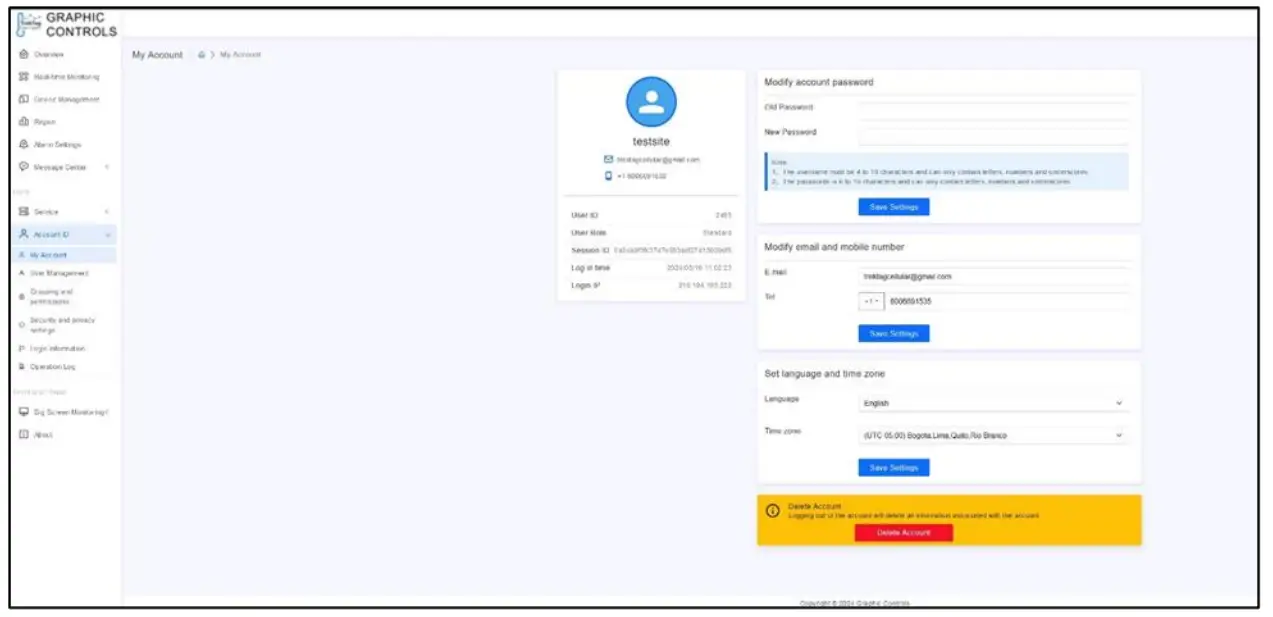
- Set up your full account information – In the account information section, you can modify the account password, email address, mobile phone number, time zone and cancel the account. Fill out as much information as possible up front, and this will save time later. Here is the screen you should be looking for:

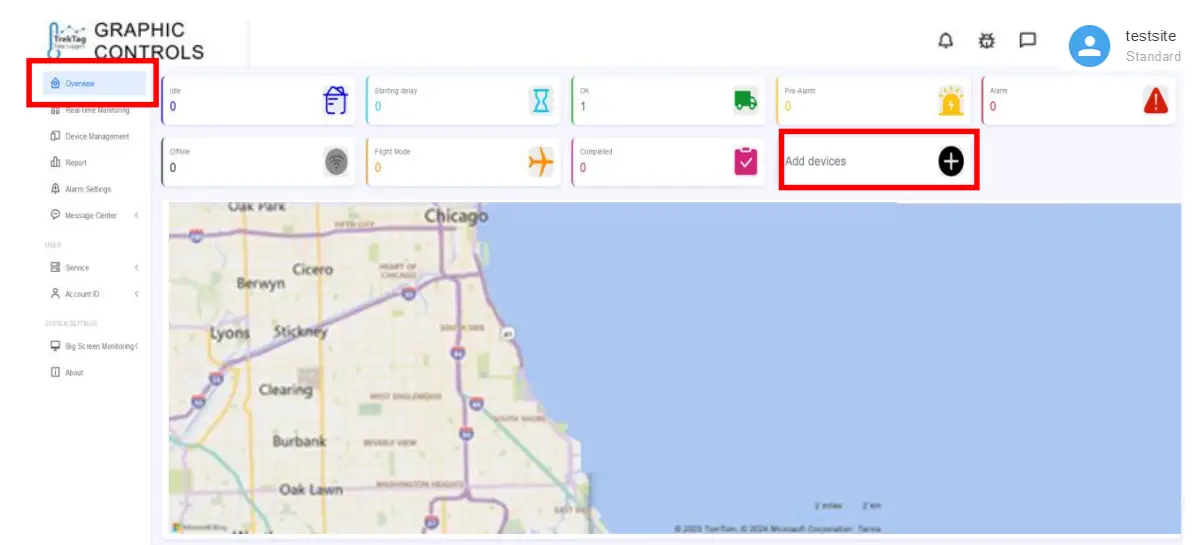
Please keep in mind that if you choose to DELETE your account, all information and saved shipment information will be lost, including any saved .PDF reports, Excel files etc. Be sure to use caution when navigating this section of the set-up process. - Add your Device – You will want to navigate to the “Overview” page, with a tab located on the left side of the screen. The Overview page is a great area of the software because it shows you a variety of units (if registered) and their different statuses. You will be able to see which loggers are active, stopped, headed for an alarm, in an alarm state currently etc. From the Overview page you will ADD new loggers
After selecting “Add Device”, you will see a window which asks you to enter a device name and device number. Device name is what you want to name the device to differentiate it from other devices in your dashboard. The device number is located on the back of the TrekTag unit and is easily recognize below the corresponding barcode. We will cover “Group” in later sections, but if you have multiple trucks, containers etc., that need to have one set of temperature and humidity ranges and a second set that will have an alternate range, you can set up a group to reflect this and assign loggers to that group, which saves on the set up time once the group is set up.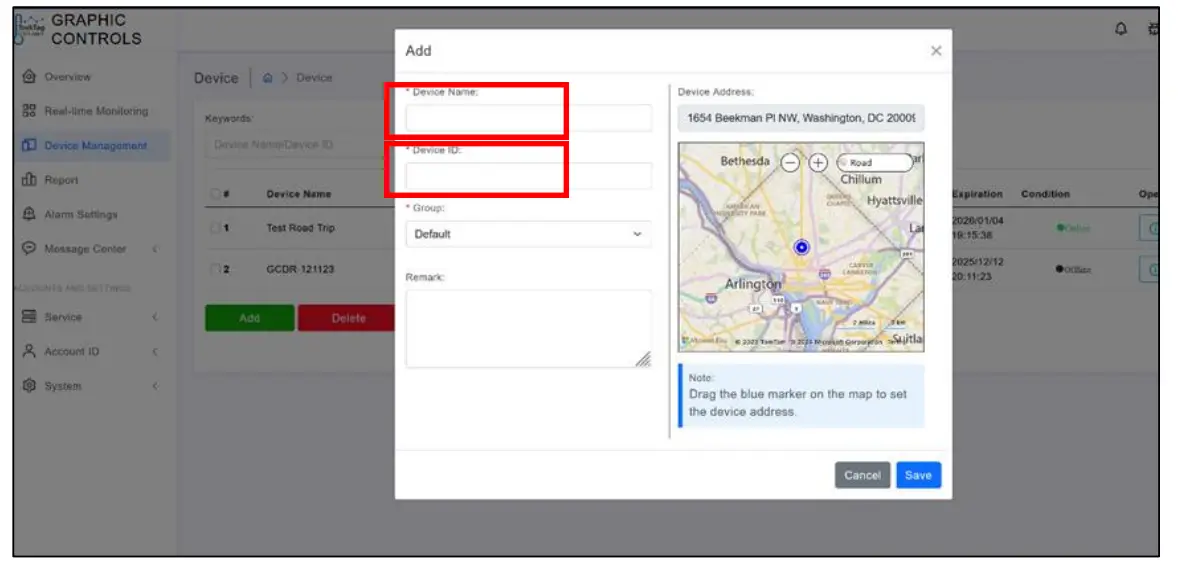
Once set up, you will see in Device Management / Device Details the logger: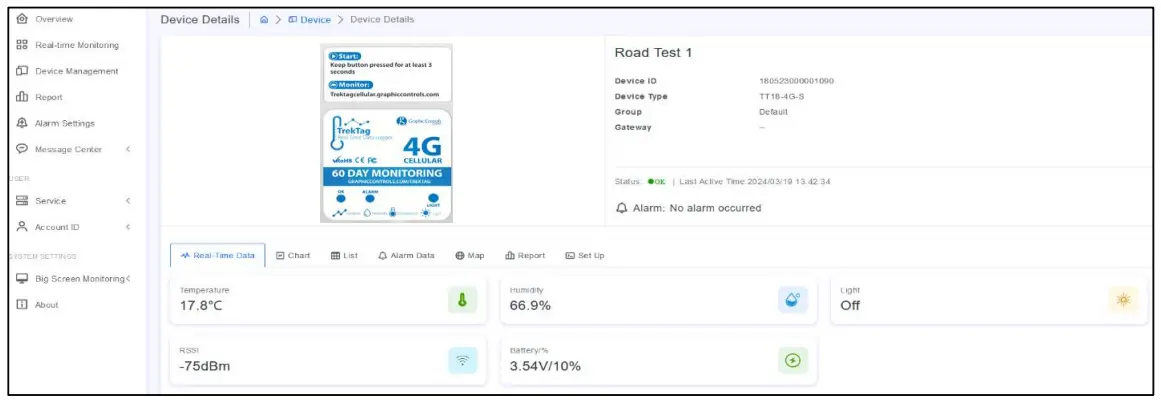
From the Overview page you will note the status icons to see “at a glance” what you have deployed: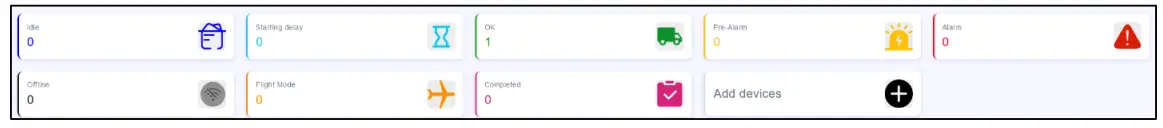
Please note this is a demo version of the software so not too many devices are connected. Real world results / users will see a more impactful dashboard. - Setting your temperature and humidity ranges – Now you will set your temperature and humidity ranges necessary to keep your shipment within specification and keep you at ease that your shipment will arrive as planned, or you will receive an alarm warning that things are not as intended. From the left navigation, choose the tab “Alarm Settings” to take you to the Alarm settings page. There will be a dialog box/window that pops up to allow you to name your alarm type, in this example,e it is Fresh Fruit. You can set the high/low for temperature and humidity and set the alarm temperature and humidity, in essence giving you the opportunity to take corrective action prior to extremes for each reading occurring. You will note here you can set a “Group” up and when setting up future loggers as described in section 5.3, you can assign to this group and the settings should automatically populate.


Once the devices are deployed and you have your parameters set, you will be able to navigate to the left and find the “Real-Time Monitoring” tab to see your dashboard of units. The color coding makes it easy for you to see if you have a good set of shipments or if there are issues that need to be addressed. Here is an example of a set of deployed loggers in action: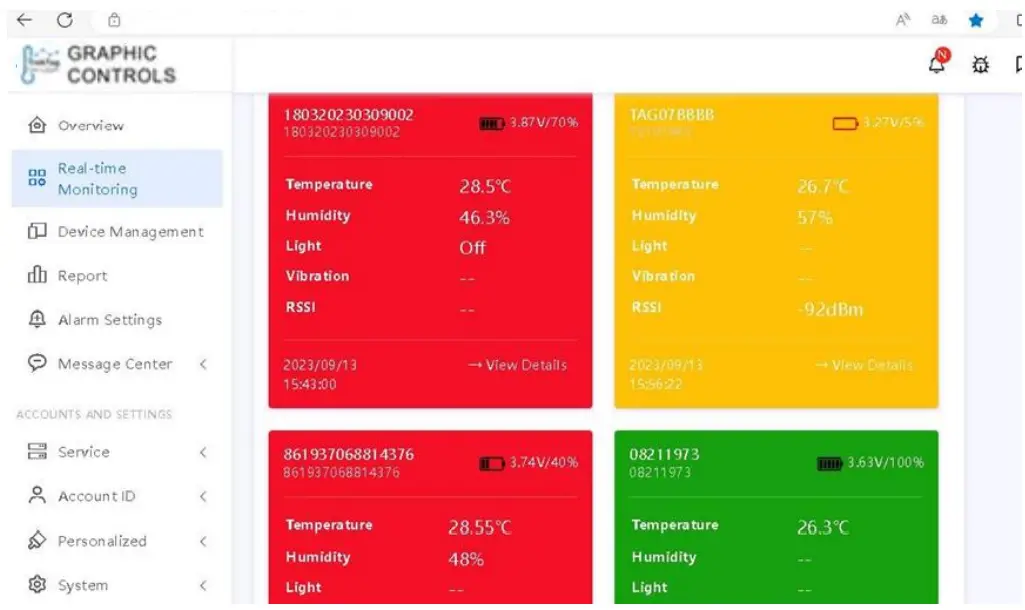
The alarm scheme supports multiple groups of alarms. When an alarm occurs on the same device, the system will select the alarm scheme with the largest condition range.
Color description: A. Gray = offline; B. Green= normal; C. Red = alarm; D. Yellow = forewarning of alarm
Report Generation
- Real-time and historical data reporting – By selecting to the “Device Management” tab on the left side of the page, you will see the list of devices you have logged into the portal. To look at a specific logger, select it from the list and click the black icon at the far right to open up the reports:
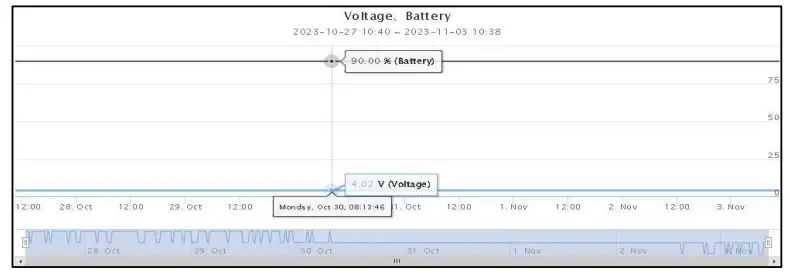
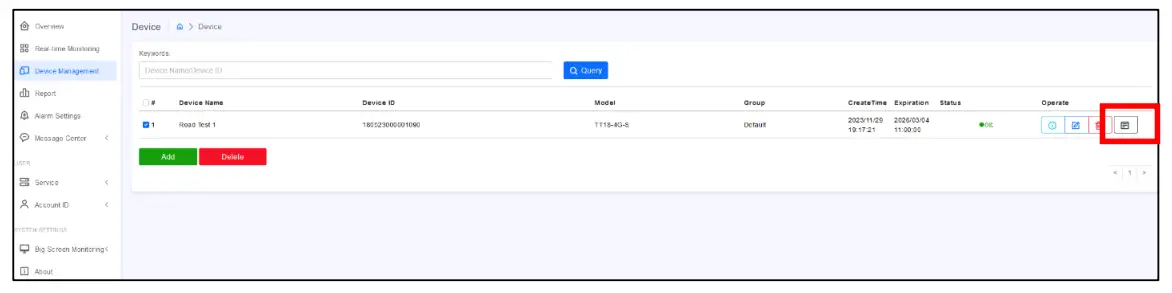 After selecting the logger, you will have access to different presentations of the information over the course of the logger’s journey. The “Chart”, “List”, “Alarm” and “Map” tabs provide VIEWS of the data, not downloadable reports. The information is available for active loggers as well as loggers that are not in service. Once you select the black icon (shown above) you will see different tabs, including a set of charts for temperature, humidity, Cell strength (RSSI) and battery life remaining (if still active):
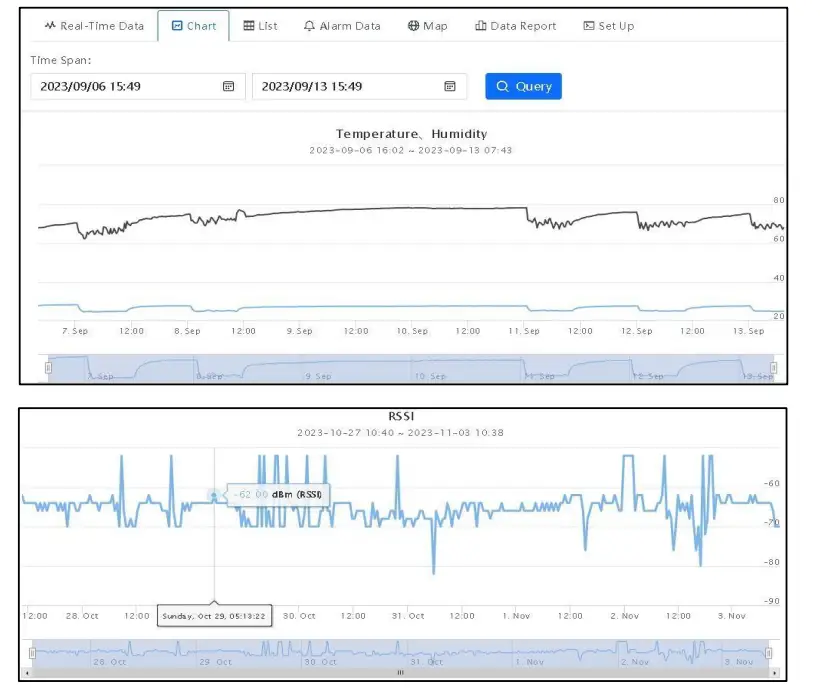
The temperature and humidity information is also available in “list” form by moving to the next tab:
Alarm history: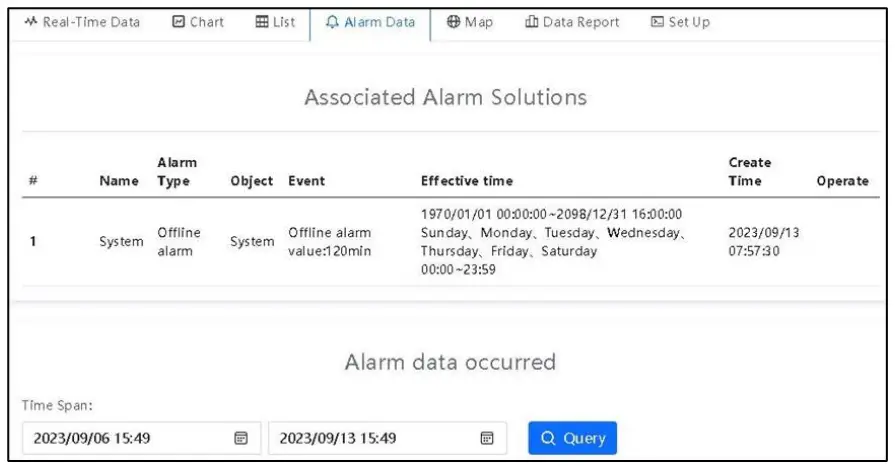
Current location / location history if not still active: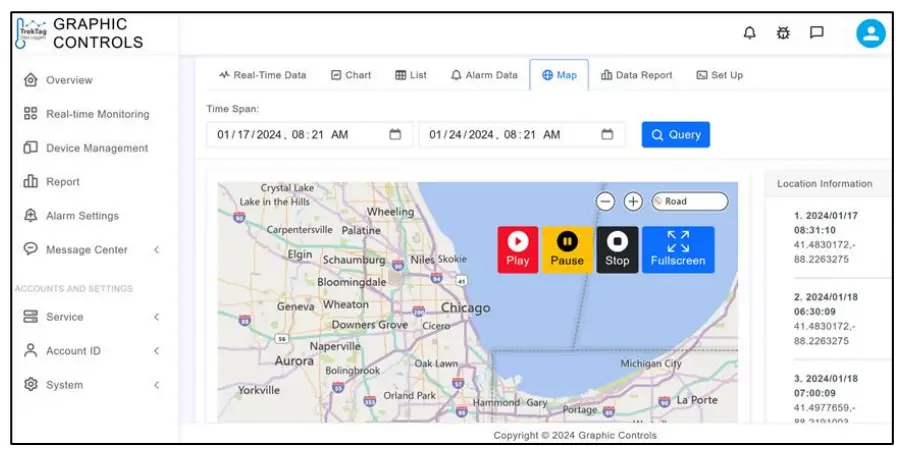
- Data report downloads – Reports can be downloaded to PDF and / or Excel for record keeping and for use when shipments have damage or spoilage. For the chosen datalogger, you will see the report history and the reports are available in .PDF or Excel format.
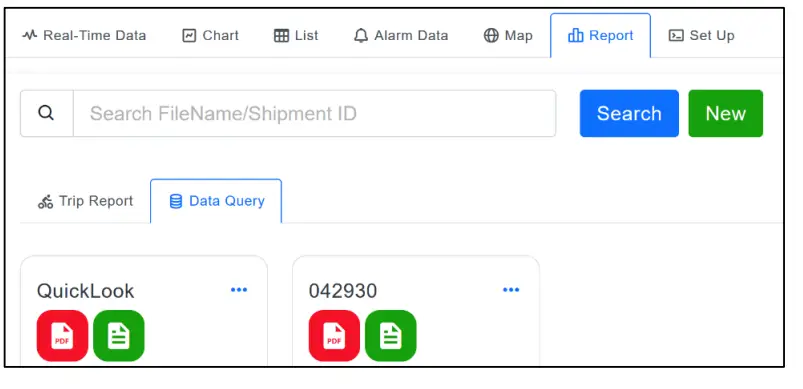
To create a new report, select the “Data Query” tab, then click “New” and it opens a window that allows users to create a file name and custom date range to be included in the report output.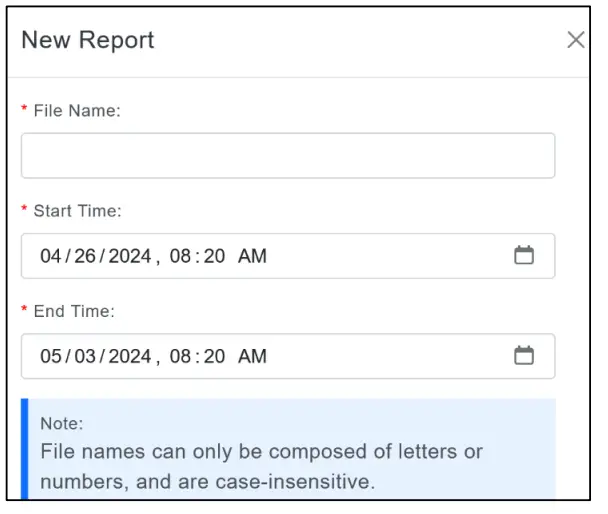
Some sample outputs:
The PDF report format is as follows:
Summary page is the cover page and then the subsequent pages are the data that was captured at each interval, as set by you, the user: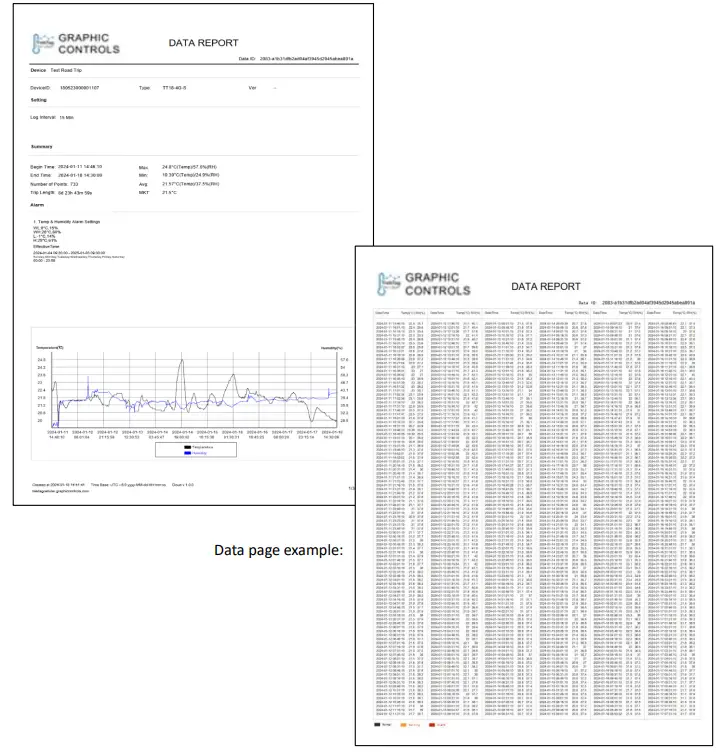
Excel format is slightly different presentation of the information: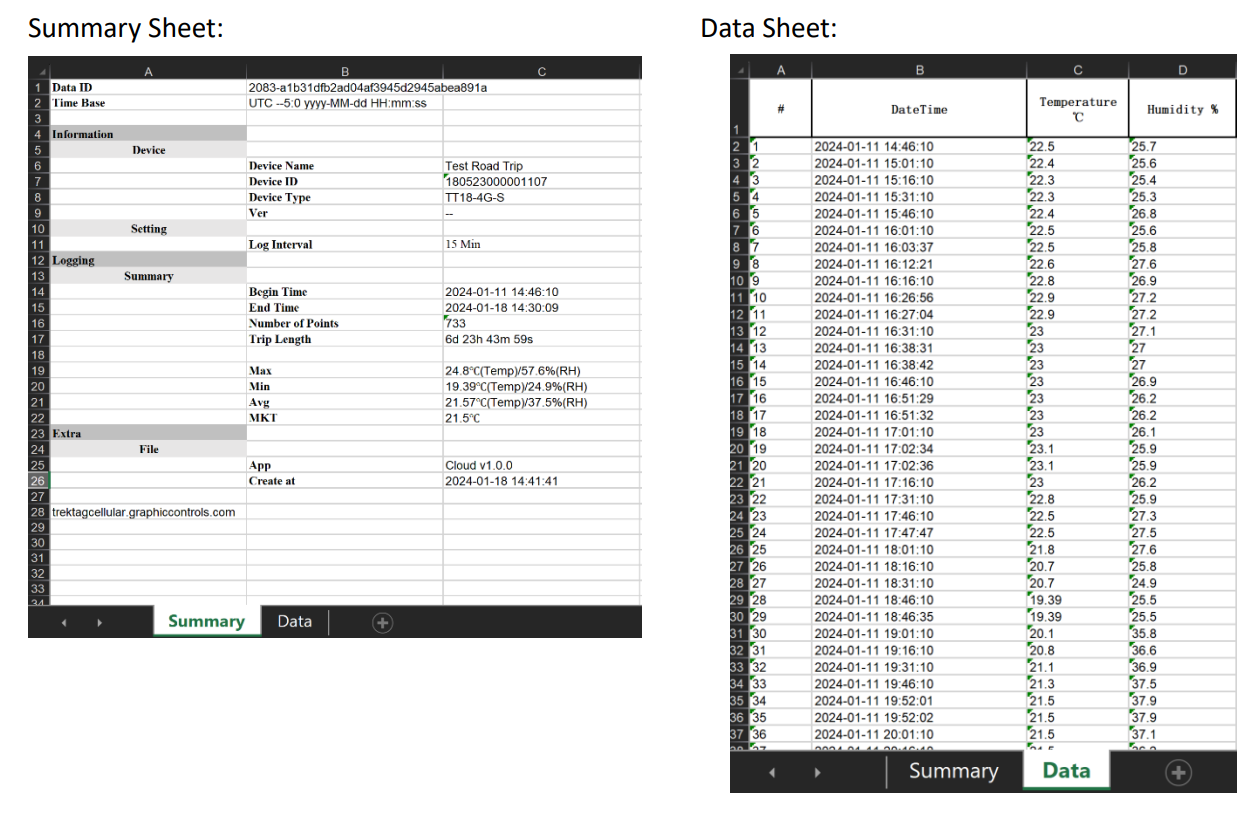
Lastly, you can adjust the interval for readings in the “Set Up” tab within the Device Management page. Keep in mind the default is readings every 15 minutes, which allow for 60 days monitoring. 60 days is the known maximum number of days for monitoring. If you increase the readings interval, you will shorten the number of days of logging, i.e. 10-minute interval may shorten to 45 days of readings. Also, if you know there will be airflight involved, the logger can be set to go into “airplane mode” so it is not looking for cell service during the flight. In this example we have allowed for 30 minutes to get to the flight and the flight duration oof 4.5 hours. The unit WILL CONTINUE to take readings, they will not transmit or be visible on cloud during flight.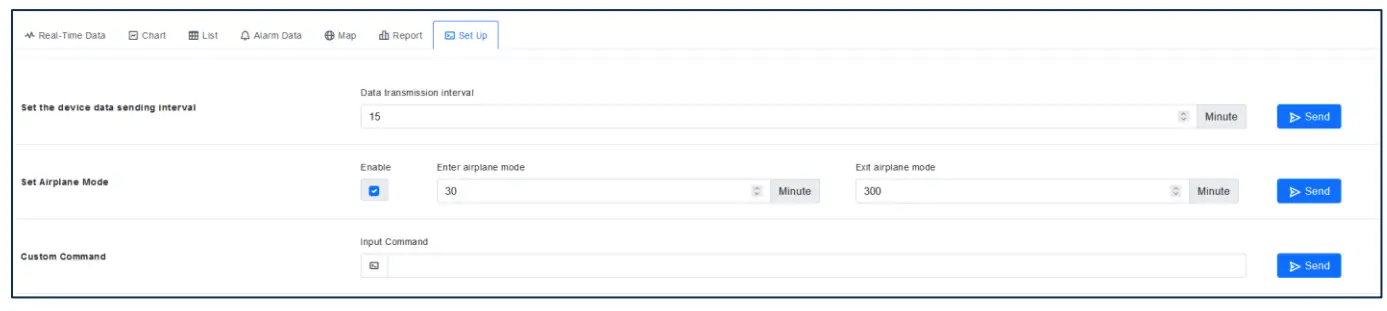
Account Settings
- Basic settings – In My account, you can modify the account password, email address, mobile phone number, time zone and cancel the account. Remember that once an account is canceled or deleted, the information is not recoverable.
- Sub-accounts – Sub-accounts can be easily added from the User Management tab. Manage users with the “Add” / “Delete” buttons. To edit a user, click the icon with the pencil.

Within the User set up, you can set up a sub account user with all permissions, “Sub account”, and you are also able to set up sub accounts with view or “query only” access / permission.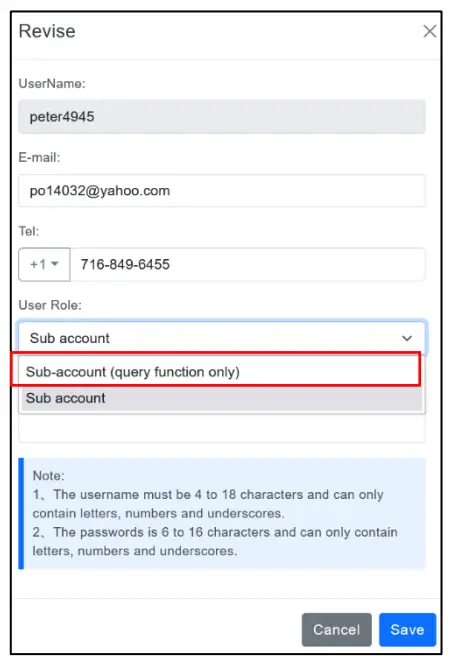
- Permissions – If you have not set up device groups, there will be a default “Group”. However, if you set up your devices to be within specific groups, you can set up permissions for sub accounts to view all or select groups:

Click the “Permission” button on the left navigation options to reveal the groups. If users did not set up specific groups, a default group will appear. In the following example, we have selected group “Test 1” and clicked Permission, which reveals all the sub accounts that are set up by the account manager. We have checked the peter4945 and Wouter123 sub accounts as having access to the Test1 group of loggers.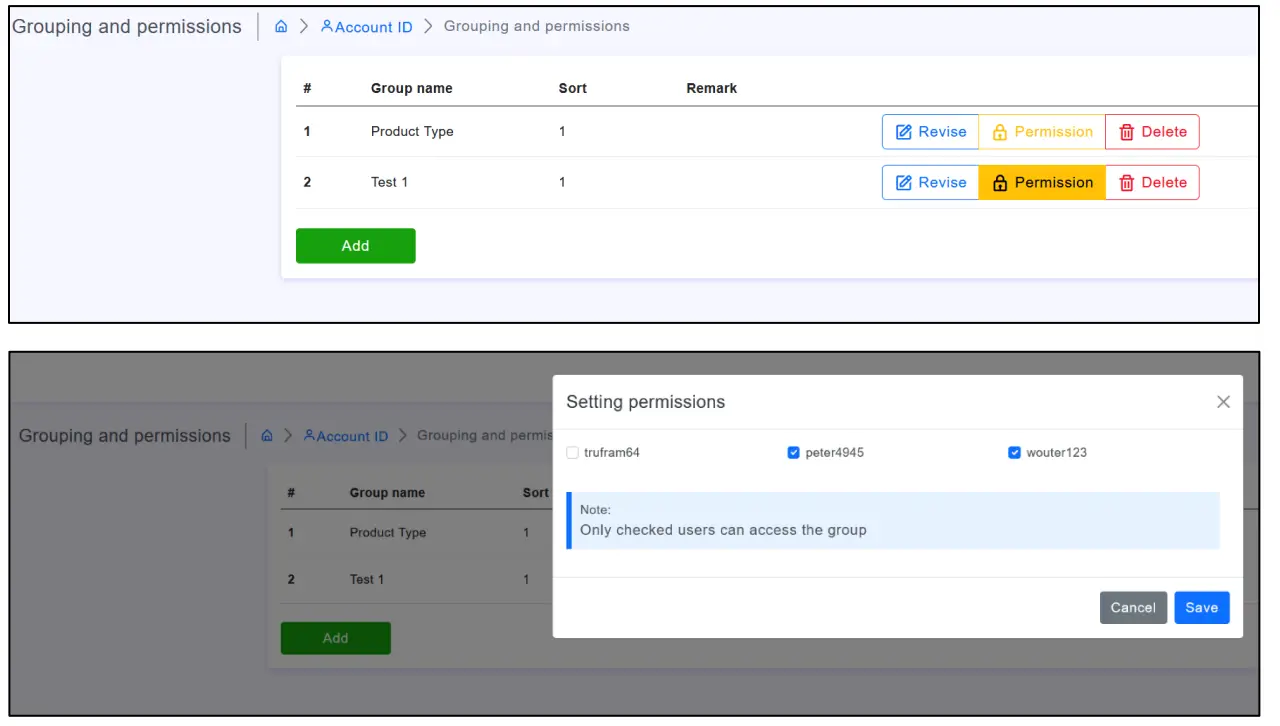
Now that this is set up, a sub user may sign in to the TrekTag domain at https://trektagcellular.graphiccontrols.com and sign I using their user name and password. They will have full access or query-only access to see the loggers.
Big Screen Monitoring – This is possible. If you have a vast network of loggers, you can get a quick location visual using Big Screen Monitoring.
Set the logger group to be monitored, all or a specific group: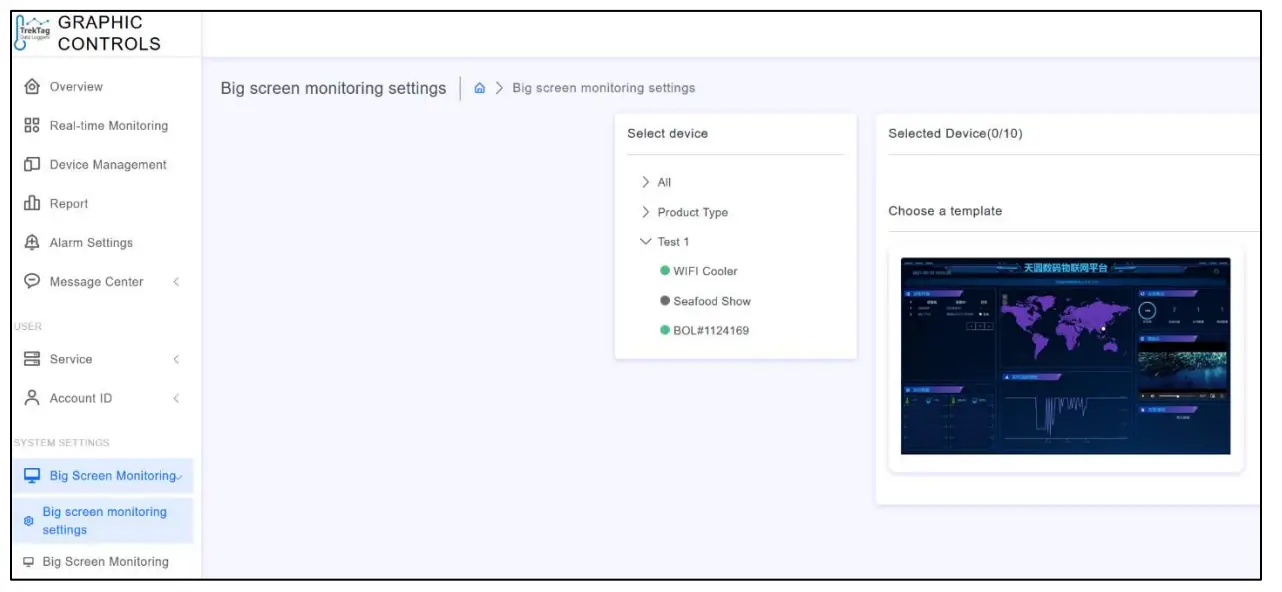
Then choose “Big Screen Monitoring” from the left navigation options to reveal a large dashboard:
Now you are set to use the TrekTag Cellular device. Use the device in a variety of applications and ranges to make sure valuable shipments make it to their destination according to the transit specifications.\ The Graphic Controls TrekTag Team
FAQ
- Q: How do I adjust the data interval for readings?
- A: You can adjust the interval in the Set Up tab within the Device Management page. The default is readings every 15 minutes, allowing for 60 days of monitoring.
- Q: What do the different alarm colors signify?
- A: Gray indicates offline status, green means normal operation, red signifies an alarm, and yellow indicates a forewarning of an alarm.
Documents / Resources
 |
Graphic Controls Trek Tag 4G Cellular Temperature Data Logger [pdf] User Guide Trek Tag 4G Cellular Temperature Data Logger, 4G Cellular Temperature Data Logger, Temperature Data Logger, Data Logger |