![]() Venus Control Suite Monitoring App
Venus Control Suite Monitoring App
Quick Guide
This guide explains how to access the Monitoring App within Venus Control Suite and helps the user understand the Monitoring App dashboard.
Accessing the Monitoring App
- Log in to Venus Control Suite.
- Click Monitoring in the My Apps menu or select it from the apps list. Refer to Figure 1.
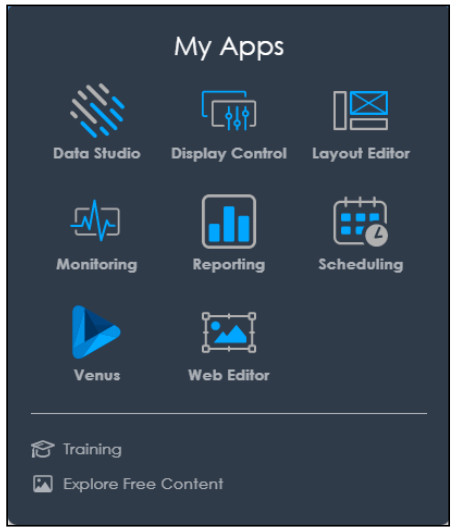 Figure 1: My Apps Menu
Monitoring App Dashboard
Once inside the Monitoring App, the Dashboard shows a tile for each display in the current account and in any sub-accounts. These display tiles show account names for displays owned by sub-accounts, connection information, and thumbnails of the recently played content.
Refer to Figure 2 and Figure 3. If the Dashboard shows more than 15 displays, the display tiles will condense to enable more displays to be viewed. More detailed information is available via a slide-in by selecting a tile. Refer to Figure 3.
A filter menu is on the right side of the screen to help navigate the list of displays. Refer to Figure 4. Select a filter condition to more easily locate the desired displays.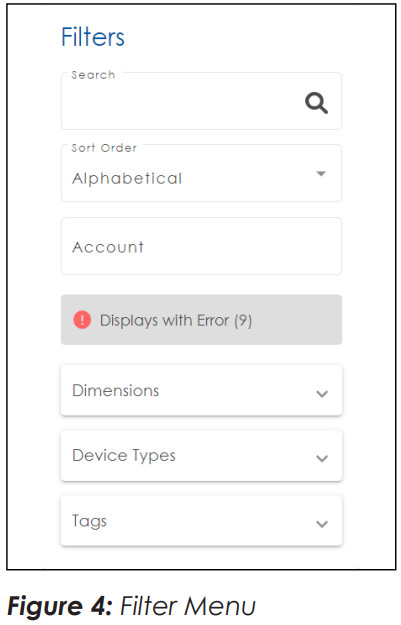
Dashboard Tiles
The tiles provide a snapshot of information for the display. The full tile switches between different views by using the ![]() and
and ![]() buttons. Click the
buttons. Click the ![]() button to open Recently Played view and a frame from the recently played content. Recently Played is the default view when entering the Monitoring App. Refer to Figure 5. Click the
button to open Recently Played view and a frame from the recently played content. Recently Played is the default view when entering the Monitoring App. Refer to Figure 5. Click the ![]() button to open the Status view and the associated account, name of the display, the player, the date and time of the last connection, and the date and time of the last download. Refer to Figure 6. The
button to open the Status view and the associated account, name of the display, the player, the date and time of the last connection, and the date and time of the last download. Refer to Figure 6. The ![]() is the Webcam View. It shows the webcam of the associated display.
is the Webcam View. It shows the webcam of the associated display.
The tiles also have other important functionality. The first is to provide information on the assigned layout.  This information allows for a quick overview of layouts and a link to Layout Editor, if changes need to be made. The second is a dropdown menu to select and view devices associated with a display when multiple devices are available.
Click on a collapsed display tile to open a slide-in display menu on the right side of the browser. Refer to Figure 7. This slide-in contains the Status and Recently Played views, as well as webcam viewing (if configured).
Liveview
For customers with a Venus Professional subscription level or higher, the slide-in and expanded menus will have buttons that lead to a popup of the Liveview. Liveview also shows the time of the last screenshot in the bottom-left corner of the popup. Refer to Figure 8.
Device Status
The Monitoring App displays information on the various statuses of the individual devices. These statuses, visible on the tiles in the Monitoring App, provide a better understanding of the different device states and present a quick overview of the current status. Possible device statuses are as follows:
- Communication Error – The display/device is offline. Refer to Figure 9.
- Download In-Progress – The device is downloading information. Refer to Figure 10.
- Insufficient Space – The device does not have enough free memory to download the new playlist/content. Refer to Figure 11.
- Schedule Interrupt – An emergency alert is overriding the scheduled playlist/content.
- Schedule Disabled – The scheduled playlist/content is disabled. Refer to Figure 12.
- No Content Playing – No content is currently playing on the device.
- No Devices – No currently associated devices. Click the status to move to Device Association where a device can be added. Refer to Figure 13.
- System Health Alert/Notification – The display has a system health entitlement. Refer to Figure 14.

DD5102252
Rev 02
16 March 2023
201 Daktronics Drive Brookings, SD 57006
www.daktronics.com/support
800.325.8766![]()
Documents / Resources
 |
DAKTRONICS DD5102252 Venus Control Suite Monitoring App [pdf] User Guide DD5102252 Venus Control Suite Monitoring App, DD5102252, Venus Control Suite Monitoring App, Control Suite Monitoring App, Suite Monitoring App, Monitoring App, App |