![]() Deployment Guide
Deployment Guide
CloudVision Sensor
Version 2024.1.0
Arista Networks Arista.com
CV-UNO CloudVision Sensor
| Headquarters 5453 Great America Parkway Santa Clara, CA 95054 USA +1-408-547-5500 www.arista.com/en/ |
Support +1-408-547-5502 +1-866-476-0000 support@arista.com |
Sales +1-408-547-5501 +1-866-497-0000 sales@arista.com |
© Copyright 2024 Arista Networks, Inc. All rights reserved. The information contained herein is subject to change without notice. The trademarks, logos, and service marks (“Marks”) displayed in this documentation are the property of Arista Networks in the United States and other countries. Use of the Marks is subject to the Arista Networks Terms of Use Policy, available at www.arista.com/en/terms-of-use. Use of marks belonging to other parties is for informational purposes only.
Overview
CloudVisionⓇ Universal Network ObservabilityTM (CV UNO) is a multi-domain network observability platform that integrates application visibility with CloudVision’s network telemetry. This integration helps provide insights into the applications and workload performance across data centers, campuses, and wide area networks.
CV UNO is enabled on top of CloudVision as-a-Service (CVaaS) platform and offers cloud-based onboarding and feature delivery, using secure state-streaming to an Arista-managed cloud-native architecture.
The CV sensor is an integral component of CV UNO. The sensor is a VM deployed on-premises that facilitates viewing application data in CloudVision. The sensor collects, normalizes, and curates flow and SNMP data from various data sources. It also polls data from vCenter and subscribes to vCenter events, allowing you to view them in CloudVision. This data is forwarded to NetDL, the network data lake that combines diverse datasets and performs a machine-learning-based analysis on them. Using this data, CV UNO assists in quickly determining the source of an anomaly as being network or application based. If it is a network anomaly, CV UNO determines where the issue occurs and why.
The following image provides a high-level overview of the functionality of the CV Sensor: Familiarize with the following terminology in this document:
- CV Sensor – refers to the collector that streams the data from one or more data sources. The Sensor is responsible for starting different data sources, collecting third-party device data, and streaming it to CVP.
- Data Source – refers to the target device in the onboarding workflow. For example: vCenter, Flow, DMF, SNMP(Cisco router/switch), and so on. o vCenter Data source includes:
▪ State Provider – Virtual Machines (VMs), Hosts, Distributed Virtual Switches (DVS), etc
▪ Counters Provider – system counters, network counters, etc
▪ Tags Provider – vCenter tags
▪ Events Provider – vCenter events
o DMF Data source includes: DMF Provider
o SNMP Data sources include:
▪ SNMP Provider: SNMP Walk for Fetching System, LLDP, andInterfaces Information.
o Flow Data source
▪ IPFIX Provider
▪ NetFlow Provider
▪ sFlow Provider - Provider – A worker or goroutine responsible for pulling or receiving a single type of data, and sending it to CVP. For example: State Provider, IPFIX Provider, DMF Provider, etc.
Deploying the CV Sensor
To view data from external data sources in CloudVision, you must deploy the CV Sensor and onboard it as a data source so that it can listen to external data sources.
The CV Sensor is deployed as an OVA appliance and is intended to run on top of an ESXi server.
When you deploy the sensor using the sensor OVA, it generates a VM with the following specifications:
- Number of CPU cores: 12
- Memory: 16 Gibibytes (GiB)
- Disk Space: 124 Gibibytes (GiB)
Note: Ensure that your system/host has sufficient resources available to accommodate the sensor OVA deployment.
Note: You must also onboard any external data sources to CloudVision so that the sensor can stream or poll them for their data.
To deploy the CV Sensor, follow the steps described here:
- Generate a Service Account Token
- Add the Sensor in the UI
- Get the latest Sensor OVA
- Deploy Sensor OVA
- Add Data Source
Generating a Service Account Token
To generate a service account token:
- Login to CVaaS cluster using the URL – www.arista.io
- Navigate to Settings -> Access Control -> Service Accounts -> New Service Account.
- Create a new service account for UNO Sensor (see image):
a. Service Account Name (example, UNO-service-account )
b. Description
c. Status: Enabled
d. Roles: Select the pre-defined role sensor-enrollment. - Click the Create button. The newly added account (UNO-service-account) appears in the list of Service Accounts.
New Service Account
- Click on the newly created Service Account (UNO-service-account).
- To generate the Service Account Token:
a. Enter a Description and select a Valid Until field.
b. Select an expiry date that is at least after a year from the current date.
c. Click the Generate button.

Note: When the token is generated, copy and securely save it in a location where it can be accessed during sensor deployment.
Adding the Sensor to the UI
To add the sensor to the CVaaS UI:
- Navigate to Devices -> Device Registration -> Data Sources
- Click the + Add Sensor button
- Enter a desired sensor name (for example, sensor1). Make sure to use the same name while deploying the sensor.
Note: Do not use default as the sensor name. - Click the Add button.
No additional information is required except for the Sensor Name.

Getting the Latest Sensor OVA
Download the UNO Sensor if you already have the OVA file or contact your Arista support representative for download instructions.
Deploying the Sensor OVA
To deploy the Sensor OVA:
- Navigate to the vCenter where you intend to deploy the sensor OVA.
Right-click on the ESXi server. - Proceed to Deploy OVF Template and enter the URL of the latest Sensor OVA (see images below).

- Specify the VM name, datastore, and other required details during the deployment (see image below).

Booting up the Sensor
To boot up the Sensor for the first time after the Sensor deployment is completed:
- Power on the VM and choose to LAUNCH REMOTE or WEB CONSOLE.
- Log in using the credential: Username: cvpadmin
- Set a password for the root user.
- When the sensor installation menu is displayed, select the install option by typing “i” or “install” (case sensitive).
 The initial configuration screen appears (see image).
 - Enter the following details:
a. IP Address of eth0: Obtain the static IP from the vCenter administrator.
b. DNS Domain Search List: Multiple entries can be added using a comma separator.
c. CV_ADDR: This is a preconfigured field depending on the region, please refrain from making any changes in a production deployment. The expected URLS based on the regions are:
i. United States 1a: www.arista.io
ii. United States 1c: www.cv-prod-us-central1-c.arista.io
iii. Japan: www.cv-prod-apnortheast-1.arista.io
iv. Germany: www.cv-prod-euwest-2.arista.io
v. Australia: www.cv-prod-ausoutheast-1.arista.io
vi. Canada: www.cv-prod-na-northeast1-b.arista.io
vii. United Kingdom: www.cv-prod-uk-1.arista.io
d. Sensor Name: Provide the same name used while adding the sensor on UI (For example, sensor1). - Verify the configuration by typing “v” or “verify.”

- Once verification is successful, apply the configuration by typing “a” or “apply”.
While the configuration is being applied, you are prompted to add the access_token in the file /etc/cvpi/access_token as follows. The setup wizard waits for you to create this token file.
- To add the token, SSH to the VM as the root user and use the token generated in Generating a Service Account Token step and enter it in the /etc/cvpi/access_token file.
- Copy the service account token and execute the following command on the sensor VM to set it:
 The above command writes the copied token to the /etc/cvpi/access_token file on the Sensor VM. Once you create and save this token file, the setup wizard automatically proceeds with the installation process.
 - Type s or save to save the configuration.
- Once the installation is successful, all the components, including the sensor, will be up and running.
- Verify the status by SSHing to the VM and by using the command: cvpi status all -v3.
For Sensor Streaming to CVaaS, the sensor name configured in earlier steps (sensor1) shows up with a green tick indicating that deployment of Sensor OVA is successful and the Sensor is able to communicate with CVaaS.
Adding the Data Sources
To add data sources:
- Go to Network -> Device Registration -> Data Sources
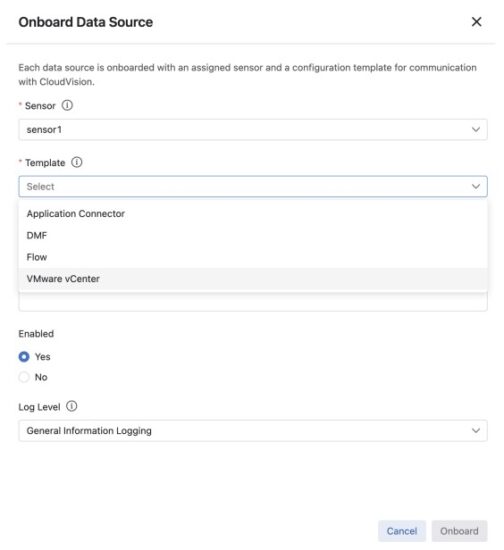
- Click the + Onboard Data Source button.
- Choose the sensor from the dropdown list (for example, sensor1)
- Select the required device type template, such as Application Connector,
DMF, Flow, or VMware vCenter. - Enter the necessary fields and click Onboard to add the data source.
 After adding the data sources, check if the data is streaming successfully. A green tick in front of each data source (under sensor1) indicates successful streaming and a red mark indicates an issue with the streaming (see image below).
- Click the sensor to access the streamed data source details and for any status message indicating if the sensor has started or there is an error message under Sensor Details.
 Similarly, you can click on each onboarded data source to display the respective data source status messages (whether the data source has started or if there are any errors).
Now, you can view the onboarded data sources and confirm that data streaming has started.
Adding VMware vCenter as a Data Source
To add VMware vCenter as a Data source:
Select the VMware vCenter template to onboard vCenter as a Data Source in CloudVision. Use the read-only credentials to onboard your vCenters. CloudVision does not perform any write operations in vCenter.
Note: If you choose the option Skip Certificate Verification as no for vCenter data sources, provide the CA certificates if the vCenter servers are using certificates issued by a private or internal CA. These certificates are required for successful TLS verification between the Sensor and vCenter servers.
Or, choose the option Skip Certificate Verification as yes if you do not have the CA certificate or wish to continue without CA certificate verification. After adding VMware vCenter as a Data Source in CloudVision, it is recommended to configure the following in the vCenter to enable proper CV UNO functionalities:
- Enable LLDP transmission on Distributed Virtual Switches (DVS)
- Enable Netflow on Distributed Virtual Switches
Enabling LLDP in vCenter
To enable LLDP for ESXi hosts managed by a DVS:
- Log in to the vCenter.
- Navigate to Hosts and Clusters → Networking.
- Right-click on the Distributed Virtual Switch used by the ESXi host in question by navigating to Settings → Edit settings → Advanced → Discovery Protocol
- Choose the Discovery Protocol as Link Layer Discovery Protocol, and Both operations.
- Click the OK button.

 CV Sensor can receive Netflow records from the vCenter. The Sensor consumes the NetFlow records from the vCenter and sends processed flow information to the CVaaS instance.
Follow these configuration steps to enable Netflow:
- Sensor Configuration for Enabling Netflow
- vCenter Configuration for Enabling Netflow
Sensor Configuration for Enabling Netflow
On the Data Sources screen, click the Onboard Data Source. Select the sensor name and then select Flow as the Template (see image). Enter a name for the data source and click the Onboard button (see image).
 vCenter Configuration for Enabling Netflow
To enable Netflow on a vCenter, you must configure each Distributed Virtual Switch (DVS). On each of the Distributed Switch in your vCenter, follow the below steps:
- Right-click the DVSwitch used by the ESXi host by navigating to Settings → Edit NetFlow

- Add the necessary details in the form as shown in the image below.
a. Collector IP: Use the Sensor IP
b. Collector port: 4739
c. Sampling Rate: 10000
Note: A sampling rate of 10,000 means that one packet will be sampled for every 10,000 packets. To capture more samples and improve visibility on the topology page, reduce the sampling rate to 1000 or less. Remember that reducing the sampling rate may introduce a slight increase in network load.
d. Switch IP address: Unique IPv4 address across VDSs in a vCenter (not necessarily a pingable IPv4 address)
- Click OK to save the changes.
After enabling NetFlow on all the DV switches, ensure to enable NetFlow on all Distributed Port Groups of the DV switches by:
- Right-click on the DVS → Distributed Port Group → Manage Distributed Port Groups
- Select Monitoring
- Select all of the Distributed port groups (Or select the applicable port groups in your environment)
- Enable the Netflow
- Click the Finish button.
After NetFlow is enabled on a port group, it sends NetFlow data to the collector specified in the DVS settings. However, the port group sends NetFlow data only for ingress packets (entering the port group) and not for egress packets (exiting the port group).
To collect data for all traffic, enable NetFlow for the Uplink port group as well. If you do not enable NetFlow for the uplink port group, the UNO sensor will not receive NetFlow for any traffic going out from the VMs to the physical network.
Note: In the bulk port group configuration, it is not possible to enable NetFlow for the Uplink port group. You must enable the uplink port group separately.
To enable the uplink port group:
- Right-click on the Uplink Port group under the Distributed Virtual Switch section → Settings (The port group name should have the DVUPlinks on it).
- Navigate to the Monitoring tab
- Enable Netflow
- Click the OK button to save the changes.
For details on Adding VMware vCenter as a Data Source, refer to:
https://faddom.com/network-visibility-in-virtual-environments-part-2/
Troubleshooting [New Installation]
This section provides information on common issues that may arise during the CV Sensor deployment and suggests possible solutions to address them.
How to restart the sensor component?
- SSH to the VM
- Execute the following cvpi commands to restart the sensor:

- After the restart, verify if all components are running correctly:

Where to check for logs?
- SSH to the VM
- The logs are managed by journald and can be viewed using journalctl commands
- Here is an example of journalctl command to view sensor logs:

Append -f to journalctl command to follow logs.
Check the logs between a specific time interval using the command:
Below are examples of journalctl commands to filter logs:
- To check all the error logs of system:
journalctl -p err -b
You can change level from err to info, warning, alert, debug - To check only stdout logs:
journalctl _TRANSPORT=stdout - To check logs from specific time:
journalctl –since “2024-01-24 17:15:00” - To check logs for specific service:
journalctl -u zookeeper.service –since today - To check logs for specific process id:
journalctl _PID=3918 - To check last 100 lines of logs:
journalctl -n 100 - To follow logs
journalctl -f - Some helpful grep commands for data source specific logs:
journalctl IO_KUBERNETES_CONTAINER_NAME=sensor -n 1000 |
grep Flow_Datasource_name ⇒ logs by datasource name
journalctl IO_KUBERNETES_CONTAINER_NAME=sensor -n 1000 |
grep provider=events ⇒ logs for events provider
journalctl IO_KUBERNETES_CONTAINER_NAME=sensor -n 1000 |
grep datasource=uvm244-vcsim3 ⇒ logs for specific datasource
journalctl IO_KUBERNETES_CONTAINER_NAME=sensor -n 1000 |
grep vcenterId=fda4fd5c-bd4e-4554-925d-f142a3232667 ⇒
logs for vcenter datasource matching given vcenter uuid
Below are some cvpi commands to check logs:
- To check current sensor pod logs
cvpi logs sensor - To check all sensor logs
cvpi logs sensor –full - To pack sensor logs to tar file
cvpi debug logs
![]()
Documents / Resources
 |
ARISTA CV-UNO CloudVision Sensor [pdf] User Guide CV-UNO CloudVision Sensor, CloudVision Sensor, Sensor |