dynamic BIOSENSORS Normalization Solution Software
Specifications
- Product Name: helicity
- Type: Normalization Solution (red dye)
- For: RT-IC measurements in the red channel
- Manufacturer: Dynamic Biosensors GmbH & Inc.
- Order Number: NOR-Ra
- For Research Use Only
- Shelf Life: Limited, check the expiry date on the label
Factors affecting excitation power:
- Fluorophore concentration in analyte solution
- Expected binding signal
- Chip type
For specific guidance on excitation power and normalization solution concentration, refer to Table 2 provided in the user manual. Note that some optimization may be required based on individual systems.
FAQs
- Q: How should I store helicity?
- A: Store heliXcyto as per the storage information provided in the user manual. Ensure to check the expiry date on the label and use it before expiration.
- Q: Can helicity be used for clinical purposes?
- A: No, heliXcyto is for research use only and should not be used for clinical diagnostics or treatment.
Key Features
- For the normalization of the fluorescent signals on Spot 1 and Spot 2 of a heliXcyto chip
- Enables correct real-time referencing of the red fluorescent signals during RT-IC measurements
- Compatible with all helicity chips
- The Normalization solution (red dye) contains a moderately hydrophilic red dye with a single positive net charge
Product Description
- Order Number: NOR-Ra
Table 1. Contents and Storage Information
| Material | Cap | Concentr action | Amount | Storage |
| Normalization solution-Ra | Orange | 10 µM | 6x 100 µL | -20 °C |
- For research use only.
- This product has a limited shelf life, please see the expiry date on the label.
Preparation
- Use this red dye normalization solution for RT-IC measurements in the red channel (analyte label-dependent).
- Dilute the 10 μM normalization stock solution to a working concentration with a running buffer.
- The concentration of the normalization solution should approximately correspond to the fluorophore concentration in the highest analyte concentration to be measured.
This can be calculated using the following equation:
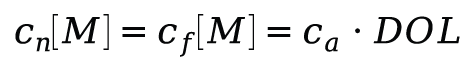
 : Concentration of the normalization solution in the desired color
 : Concentration of dye in the labeled analyte solution
 : Highest concentration of analyte that should be measured
 : Degree of labeling (ratio of dye to analyte)
Diluted solutions can be stored at 2-8°C for up to 7 days.
Application Note
In the RT-IC measurement, the fluorescent signal of the normalization solution should be in a similar range as the highest signal coming from the bound analyte (raw data). The absolute fluorescent signal is dependent on normalization solution concentration and the excitation power applied in the measurement. The excitation power has to be selected based on the following parameters:
- a. Fluorophore concentration in analyte solution:
- The fluorophore concentration depends on the analyte concentration used in the measurement as well as the degree of labeling of the analyte. For high DOL and high analyte concentrations, lowering the excitation power might be required.
- b. Expected binding signal:
- Highly expressed targets on a cell can bind more molecules of the labeled analyte. In the case of highly overexpressed targets, a strong binding signal can be expected. To avoid the shutter closing, lowering the excitation power might be considered.
- c. Chip type:
- Different chip types have varying fluorescent backgrounds. The bigger the traps and the more traps on the chip, the higher the background signal. Therefore, L5 chips might require lower excitation power than applied to M5 chips.
For a starting point of excitation power and norm. solution concentration to be used in an RT-IC experiment, please refer to Table 2. Table 2. Relation of fluorophore concentration, normalization solution concentration, and excitation power suitable for a heliXcyto M5 chip
| Analyte dye conc. = analyte cons x DOL | Excitation power | Concentration Normalization solution | Dilution Normalization solution |
| 25 nM | 0.5 | 25 nM | 1:400 |
| 50 nM | 0.3 | 50 nM | 1:200 |
| 100 nM | 0.2 | 100 nM | 1:100 |
| 300 nM | 0.1 | 300 nM | 1:33 |
| 500 nM | 0.08 | 500 nM | 1:20 |
| 1 µM | 0.05 | 1 µM | 1:10 |
| 2.5 µM | 0.02 | 2.5 µM | 1:4 |
Note: This table is for your guidance. However, the final signal recorded in the helicity depends on many factors. Thus, some optimization will be required for each system.
Contact
- Dynamic Biosensors GmbH
- Perchtinger Str. 8/10
- 81379 Munich
- Germany
- Dynamic Biosensors, Inc.
- 300 Trade Center, Suite 1400
- Woburn, MA 01801
- USA
- Order Information order@dynamic-biosensors.com.
- Technical Support support@dynamic-biosensors.com.
- www.dynamic-biosensors.com.
- Instruments and chips are engineered and manufactured in Germany.
- ©2024 Dynamic Biosensors GmbH
- Dynamic Biosensors, Inc. All rights reserved.
- NOR-Ra v1.0
- www.dynamic-biosensors.com.
- Dynamic Biosensors GmbH & Inc.
- NOR-Ra v1.0
Documents / Resources
 |
dynamic BIOSENSORS Normalization Solution Software [pdf] User Guide NOR-Ra, Normalization Solution Software, Solution Software, Software |


