1. Introduction
This manual provides detailed instructions for the safe and effective operation of the SIGLENT SVA1015X Spectrum Vector Analyzer. The SVA1015X is a versatile instrument designed for RF signal and network analysis, offering a frequency range from 9 kHz up to 1.5 GHz. It combines the functionalities of a spectrum analyzer and a vector network analyzer, making it suitable for various applications including broadcast monitoring, S-parameter measurement, cable and antenna testing, and EMI pre-compliance testing.
Please read this manual thoroughly before using the device to ensure proper handling and to maximize its performance and longevity.
2. Safety Information
Observe the following safety precautions to prevent injury and damage to the instrument:
- Power Source: Connect the instrument only to a power source that provides the specified voltage and frequency.
- Grounding: Ensure the instrument is properly grounded to prevent electric shock.
- Ventilation: Do not block ventilation openings. Ensure adequate airflow around the instrument to prevent overheating.
- Environment: Operate the instrument in a clean, dry environment, away from moisture, dust, and corrosive gases. Avoid extreme temperatures.
- Handling: Handle the instrument with care. Avoid dropping or subjecting it to strong impacts.
- Servicing: Refer all servicing to qualified service personnel. Do not attempt to repair the instrument yourself.
- RF Input: Do not exceed the maximum input power rating for the RF input ports.
3. Product Overview
The SIGLENT SVA1015X is a high-performance spectrum and vector network analyzer. Its design integrates advanced microwave technology and digital processing algorithms to deliver reliable and accurate measurements.
Key Features:
- Spectrum Analysis: 9 kHz to 1.5 GHz
- Vector Network Analysis: 100 kHz to 1.5 GHz
- Displayed Average Noise Level (DANL): -156 dBm/Hz (typical)
- Total Amplitude Accuracy: <1.2 dB
- Phase Noise: <-98 dBc/Hz @ 1 GHz, 10 kHz offset
- Resolution Bandwidth (RBW): 1 Hz to 1 MHz, in 1-3-10 sequence
- 10.1-inch Multi-Touch Screen Display
- Integrated Tracking Generator (100 kHz to 1.5 GHz)
- Supports Distance-to-Fault (DTF) measurement (optional)
- Supports various modulation analysis types (AM/FM, ASK/FSK/PSK/QAM)
- Comprehensive power measurement functions (CHP, ACPR, OBW, T-Power, CNR, TOI, Harmonic)
Front Panel Overview:

Figure 3.1: Front view of the SIGLENT SVA1015X Spectrum Vector Analyzer, showing the large display, control buttons, and input/output ports.
The front panel features a large 10.1-inch multi-touch display for intuitive operation. To the right of the display are dedicated function keys for control, setting, marker, and measurement operations. A rotary knob and numeric keypad provide additional input methods. The bottom section includes USB ports for external storage or peripherals, a TG Source port for the tracking generator, and RF Input ports (PORT 1 and PORT 2) for signal connections.

Figure 3.2: The SVA1015X display showing a Distance-to-Fault (DTF) measurement, illustrating the graphical interface and measurement parameters.
The user interface is designed for clarity and ease of use, supporting both touch input and traditional button/knob controls. It also supports external mouse and keyboard for enhanced usability.
4. Setup
4.1 Unpacking and Inspection
- Carefully remove the instrument from its packaging.
- Inspect the instrument for any signs of damage during transit. If damage is found, contact your supplier immediately.
- Verify that all accessories listed in the packing list are present.
4.2 Power Connection
- Connect the provided power cord to the AC inlet on the rear panel of the instrument.
- Plug the other end of the power cord into a grounded AC power outlet. Ensure the voltage and frequency of the power supply match the instrument's specifications.
4.3 Initial Power-On
- Press the power button located on the front panel to turn on the instrument.
- Allow the instrument to complete its self-test and boot-up sequence. The main measurement interface will appear once initialization is complete.
5. Operating Instructions
5.1 Spectrum Analysis
The SVA1015X functions as a full-featured spectrum analyzer, allowing you to measure the magnitude of an input signal versus frequency within the instrument's frequency range.
- Connect the signal to be analyzed to the RF INPUT PORT 1.
- Press the Mode button and select 'Spectrum Analyzer'.
- Adjust the Frequency settings (Center Frequency, Span) to define the measurement range.
- Configure Amplitude settings (Reference Level, Attenuation) to optimize the signal display.
- Set the BW (Resolution Bandwidth, Video Bandwidth) for desired measurement resolution and noise reduction.
- Use Marker functions to pinpoint specific frequencies and measure their amplitude.
5.2 Vector Network Analysis (VNA)
The VNA mode allows for comprehensive characterization of RF components and networks by measuring S-parameters (S11, S21).

Figure 5.1: Display showing Vector Network Analysis results, including a Smith Chart for impedance matching and S-parameter measurements.
- Press the Mode button and select 'Vector Network Analyzer'.
- Perform a calibration using appropriate calibration kits (e.g., OSL mechanical calibration) to ensure accurate measurements.
- Connect the Device Under Test (DUT) to RF INPUT PORT 1 (for S11) or between PORT 1 and PORT 2 (for S21).
- Set the frequency range (Start/Stop Frequency) for the measurement. The SVA1015X supports VNA from 100 kHz to 1.5 GHz.
- Select the desired S-parameter (S11, S21) and display format (e.g., Log Magnitude, Phase, Smith Chart, Polar Chart, VSWR).
- The SVA1015X offers a transmission dynamic range of over 70 dB for single-port measurements.
- Utilize features like Distance-to-Fault (DTF) for cable and antenna testing, and impedance analysis for precise fault location.
5.3 EMI Pre-compliance Testing
The SVA1015X can be used for EMI pre-compliance testing, helping to identify potential electromagnetic interference issues early in the design cycle.
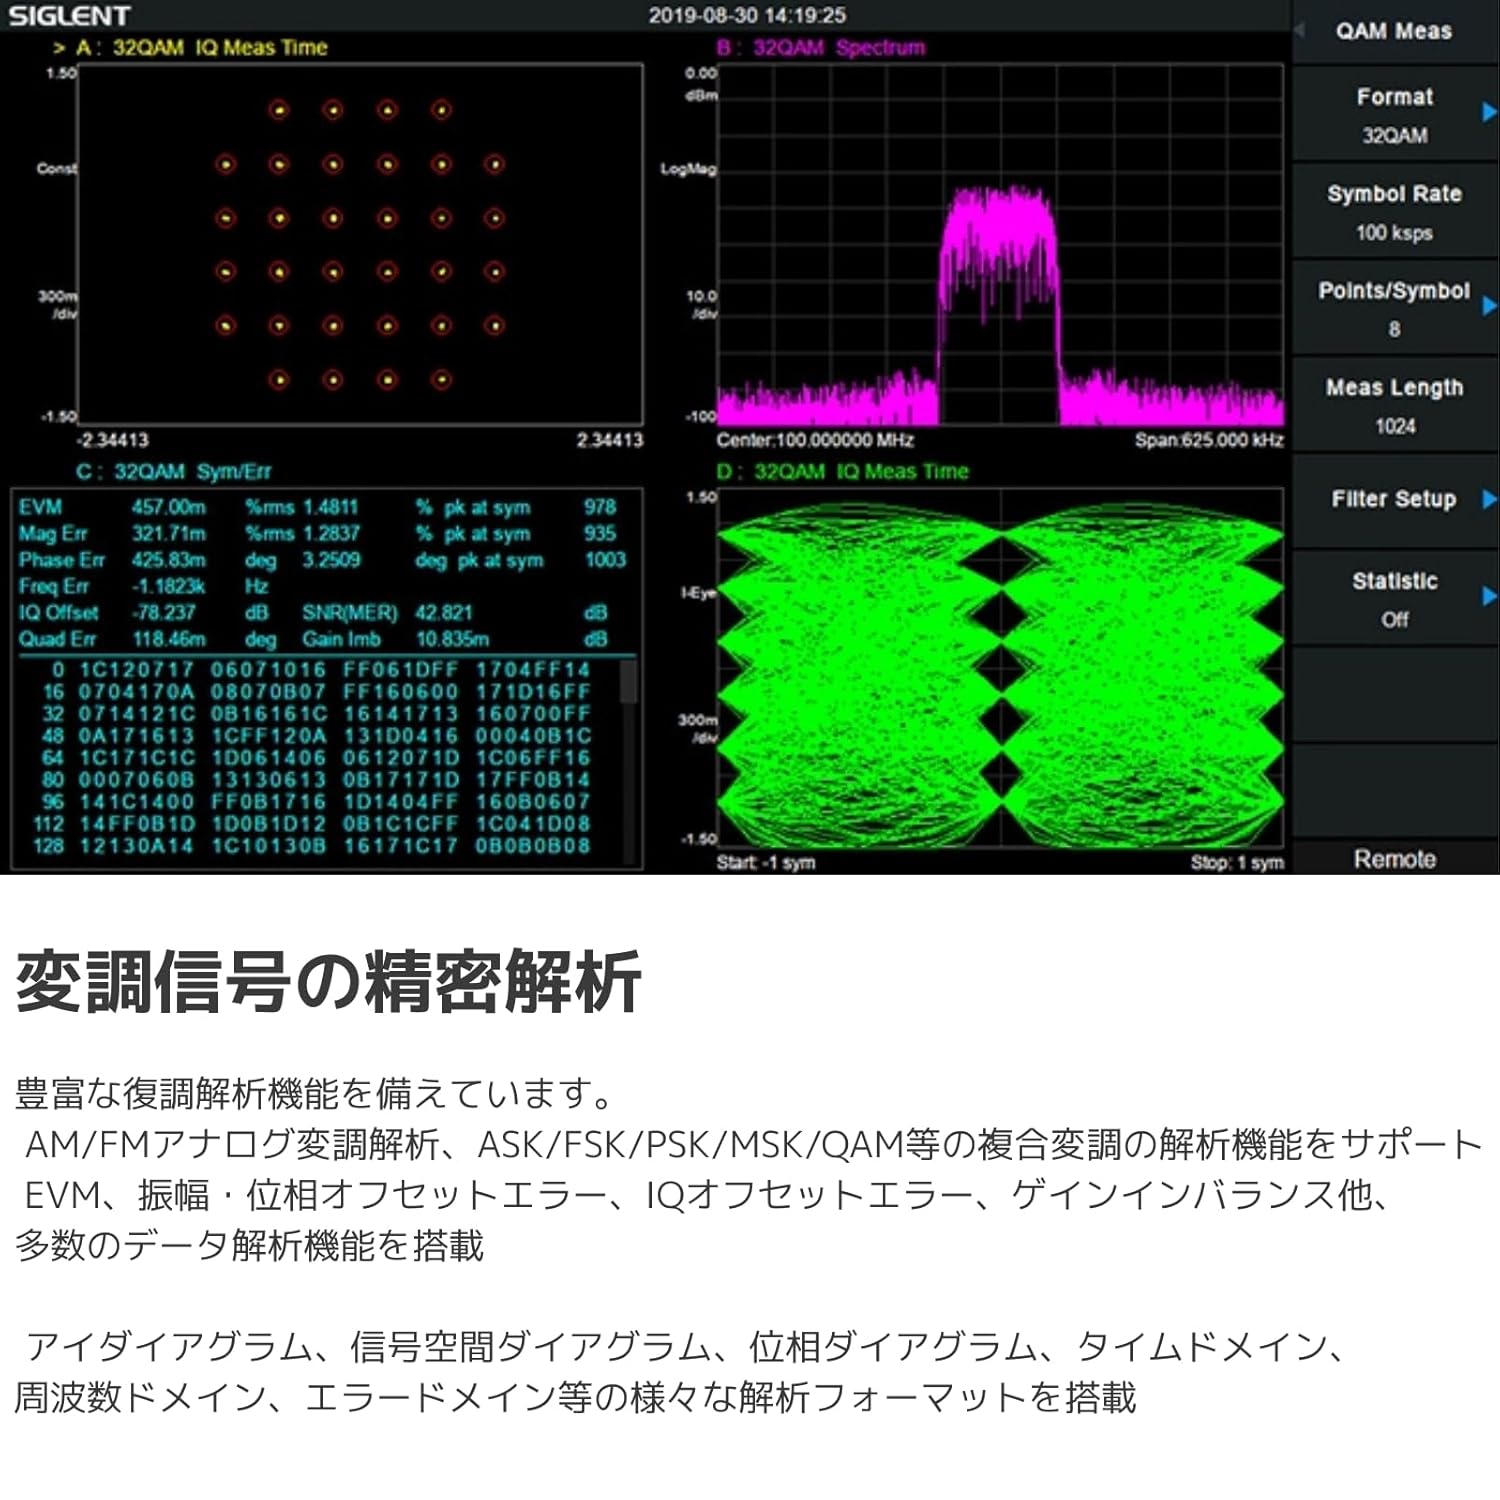
Figure 5.2: Diagram illustrating a typical setup for EMI pre-compliance testing using a Spectrum Analyzer/EMI Receiver, LISN, and attenuator.
- The instrument supports various EMI measurement functions, including EMI filters and quasi-peak detectors compliant with CISPR 16.
- Utilize built-in limit templates for international EMI standards or define custom limit lines.
- For conducted emissions, use a Line Impedance Stabilization Network (LISN) such as the 5EM5040A.
- For radiated emissions, use appropriate antennas and near-field probes (e.g., SRF5030T set) to detect interference sources from PCBs, cables, and radiation.
- PC software like 'EasySpectrum' can automate the EMI pre-compliance process and assist with project management.
5.4 Modulation Analysis
The SVA1015X offers advanced capabilities for analyzing modulated signals, supporting both analog and digital modulation types.

Figure 5.3: Screen capture showing QAM modulation analysis, including constellation diagrams and various measurement parameters like EVM and IQ offset.
- Supports AM/FM analog demodulation.
- Supports complex digital modulation analysis including ASK, FSK, PSK, and QAM.
- Provides detailed data analysis functions such as Error Vector Magnitude (EVM), Amplitude/Phase offset error, IQ offset error, and Gain imbalance.
- Various display formats are available, including Eye Diagrams, Constellation Diagrams, Phase Diagrams, Time Domain, Frequency Domain, and Waterfall Diagrams.
5.5 Power Measurement
The instrument provides a comprehensive suite of power measurement functions for characterizing RF signals.

Figure 5.4: Graphical representation of various power measurement results, such as channel power and adjacent channel power ratio.
- CHP (Channel Power): Measures the total power within a specified channel bandwidth.
- ACPR (Adjacent Channel Power Ratio): Measures the power ratio between the main channel and adjacent channels.
- OBW (Occupied Bandwidth): Determines the bandwidth containing a specified percentage of the total power.
- T-Power (Time Domain Power): Measures power in the time domain.
- CNR (Carrier to Noise Ratio): Measures the ratio of carrier power to noise power.
- TOI (Third Order Intercept): Measures the third-order intercept point, indicating linearity.
- Harmonic Measurement: Analyzes the power of harmonic components.
- Spectrum Monitor: Provides continuous monitoring of the spectrum.
5.6 User Interface and Connectivity
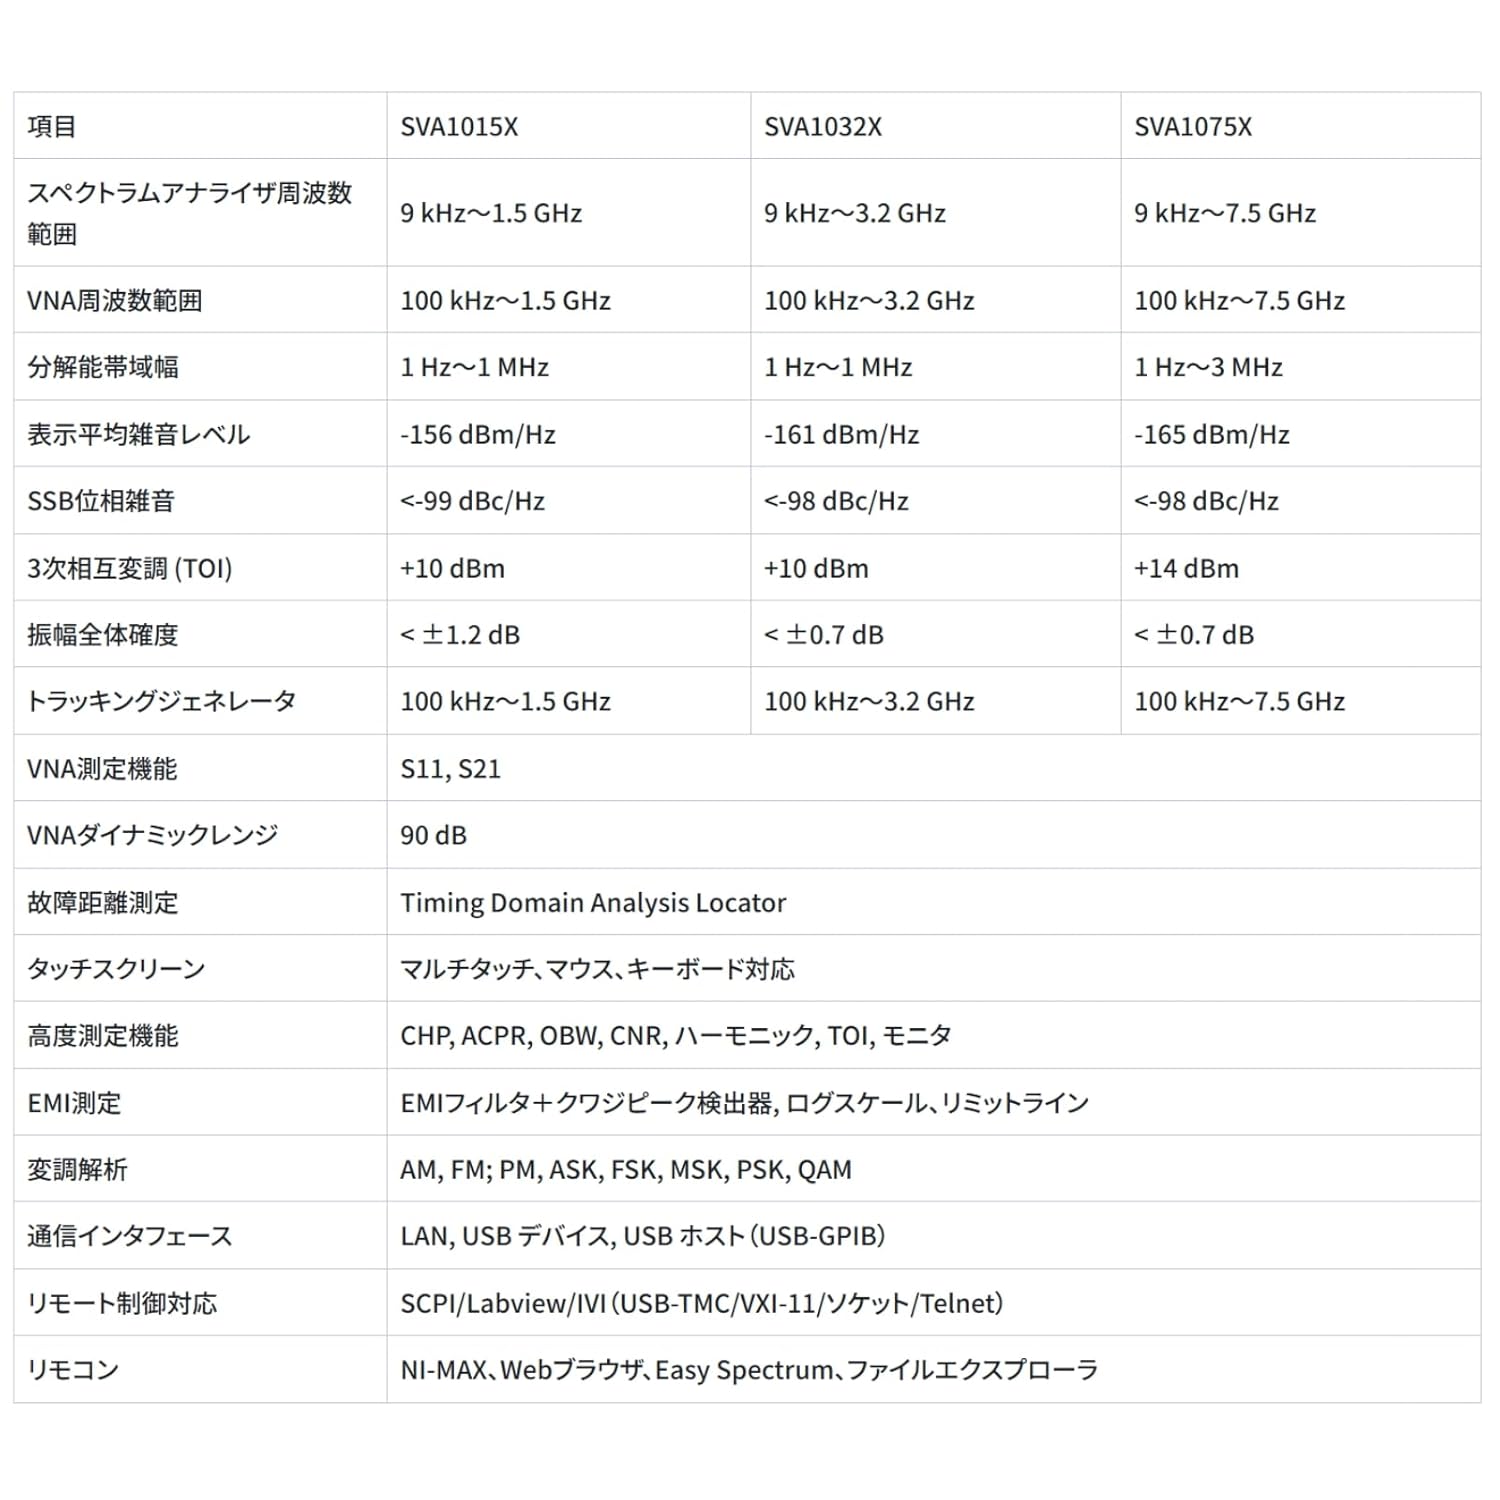
Figure 5.5: The 10.1-inch multi-touch display of the SVA1015X, demonstrating touch-based interaction for setting parameters.
- The 10.1-inch capacitive multi-touch screen provides a modern and intuitive user experience.
- Supports external mouse and keyboard for alternative control.
- Remote control functionality allows for operation from a PC or mobile device.
- Network monitoring and FTP file operations are supported for data transfer and remote management.
6. Maintenance
6.1 Cleaning
- Regularly clean the exterior of the instrument with a soft, damp cloth.
- Do not use abrasive cleaners or solvents that could damage the casing or display.
- Ensure the instrument is powered off and disconnected from the power source before cleaning.
6.2 Calibration
- For optimal measurement accuracy, periodic calibration by qualified personnel is recommended.
- Refer to the manufacturer's recommendations for calibration intervals.
7. Troubleshooting
This section provides solutions to common issues encountered during the operation of the SVA1015X. If the problem persists, contact technical support.
| Problem | Possible Cause | Solution |
|---|---|---|
| Instrument does not power on. | Power cord not connected; Power outlet faulty; Instrument fuse blown. | Check power cord connection; Test power outlet; Contact service for fuse replacement. |
| No signal displayed in Spectrum Analyzer mode. | Input signal not connected; Amplitude settings incorrect (e.g., Reference Level too low, Attenuation too high); Frequency range incorrect. | Verify signal connection to RF INPUT PORT 1; Adjust Reference Level and Attenuation; Check Center Frequency and Span settings. |
| VNA measurements are inaccurate. | Calibration not performed or incorrect; DUT not properly connected; Incorrect VNA settings. | Perform a full VNA calibration; Ensure secure and correct DUT connections; Verify VNA frequency range and S-parameter settings. |
| Touch screen unresponsive. | Temporary software glitch; Screen dirty; Hardware issue. | Restart the instrument; Clean the screen with a soft cloth; If issue persists, use external mouse/keyboard and contact support. |
8. Specifications
The following table outlines the key technical specifications for the SIGLENT SVA1015X Spectrum Vector Analyzer.
| Parameter | Specification (SVA1015X) |
|---|---|
| Spectrum Analyzer Frequency Range | 9 kHz to 1.5 GHz |
| Vector Network Analyzer Frequency Range | 100 kHz to 1.5 GHz |
| Resolution Bandwidth (RBW) | 1 Hz to 1 MHz, in 1-3-10 sequence |
| Displayed Average Noise Level (DANL) | -156 dBm/Hz (typical) |
| Phase Noise | <-98 dBc/Hz @ 1 GHz, 10 kHz offset |
| Total Amplitude Accuracy | <1.2 dB |
| Tracking Generator Frequency Range | 100 kHz to 1.5 GHz |
| Display | 10.1 Inch Multi-Touch Screen |
| Dimensions (L x W x H) | 18 x 12 x 11 inches |
| Weight | 12.05 Pounds |
| Item Model Number | SVA1015X |
| Manufacturer | Siglent Technologies NA Inc. |
9. Warranty and Support
The SIGLENT SVA1015X is covered by a manufacturer's warranty. For detailed warranty terms and conditions, please refer to the warranty card included with your product or visit the official Siglent website.
For technical support, service, or inquiries, please contact Siglent Technologies NA Inc. or your local authorized distributor. Contact information can typically be found on the Siglent website or in the product documentation.


