 User Manual Q&A
Answer

Oct 17, 2025 - 04:11 PM
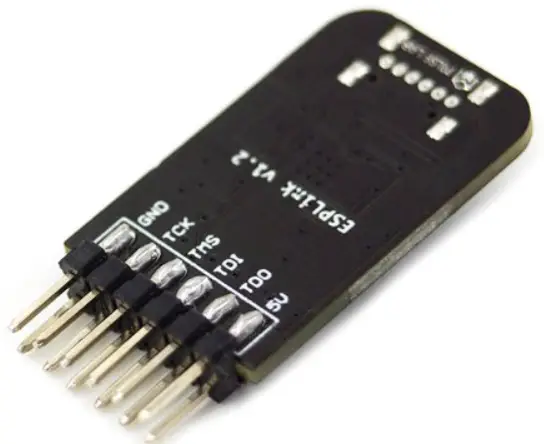
To program an ESP32-S2 chip using the JTAG interface with the ESPLink v1.2 Debug Probe Tool, follow these steps as outlined in the user manual:


1. **Openocd Installation:**

   - Clone the Openocd repository for ESP32:

     ```

     $ git clone https://github.com/espressif/openocd-...
     $ cd openocd-esp32

     ```

   - Bootstrap, configure, build, and install Openocd:

     ```

     $ ./bootstrap

     $ ./configure

     $ make -j

     $ sudo make install

     ```


2. **Attach to ESP32-S2:**

   - Run Openocd with the following command:

     ```

     $ sudo ./src/openocd -s /home/pi/oss/openocd-esp32/tcl -f tcl/interface/esp_usb_bridge.cfg -f tcl/target/esp32s2.cfg

     ```


3. **Debugging:**

   - Once attached successfully, open another terminal for debugging.


4. **Debug with Gdb:**

   - Use the following commands to debug with Gdb:

     ```

     $ xtensa-esp32s2-elf-gdb -ex 'target remote 127.0.0.1:3333' ./build/blink.elf

     (gdb) info reg

     (gdb) s

     (gdb) continue

     ```


5. **Debug with Telnet:**

   - Use Telnet to debug with the following commands:

     ```

     $ telnet localhost 4444

     reset

     halt

     reg

     step

     resume

     ```


By following these steps, you can effectively use the ESPLink v1.2 Debug Probe Tool to program and debug an ESP32-S2 chip using the JTAG interface.


Add New Comment