1. Introduction
This manual provides comprehensive instructions for the safe and effective operation of the OWON XSA815-TG Spectrum Analyzer. The XSA815-TG is a cost-effective spectrum analyzer featuring a tracking generator and a frequency resolution of 1Hz, designed for precise signal analysis.
Please read this manual thoroughly before using the device to ensure proper functionality and to prevent damage.

Figure 1: Front view of the OWON XSA815-TG Spectrum Analyzer, showing the large LCD display and control panel.
2. Setup
2.1 Unpacking and Inspection
Carefully unpack the OWON XSA815-TG from its packaging. Verify that all accessories are present:
- 1 x XSA815-TG Spectrum Analyzer
- 1 x 220V AC power cord
- 1 x USB Cable
- 1 x Quickstart guide
Inspect the device for any signs of physical damage. If any components are missing or damaged, contact your supplier immediately.
2.2 Power Connection
- Ensure the power switch on the rear panel is in the OFF position.
- Connect the supplied 220V AC power cord to the AC power connector on the rear panel of the spectrum analyzer.
- Plug the other end of the power cord into a grounded AC power outlet.
2.3 Initial Power On
Press the power key located on the front panel to turn on the device. The 9-inch LCD display will illuminate, and the system will initiate its boot sequence.
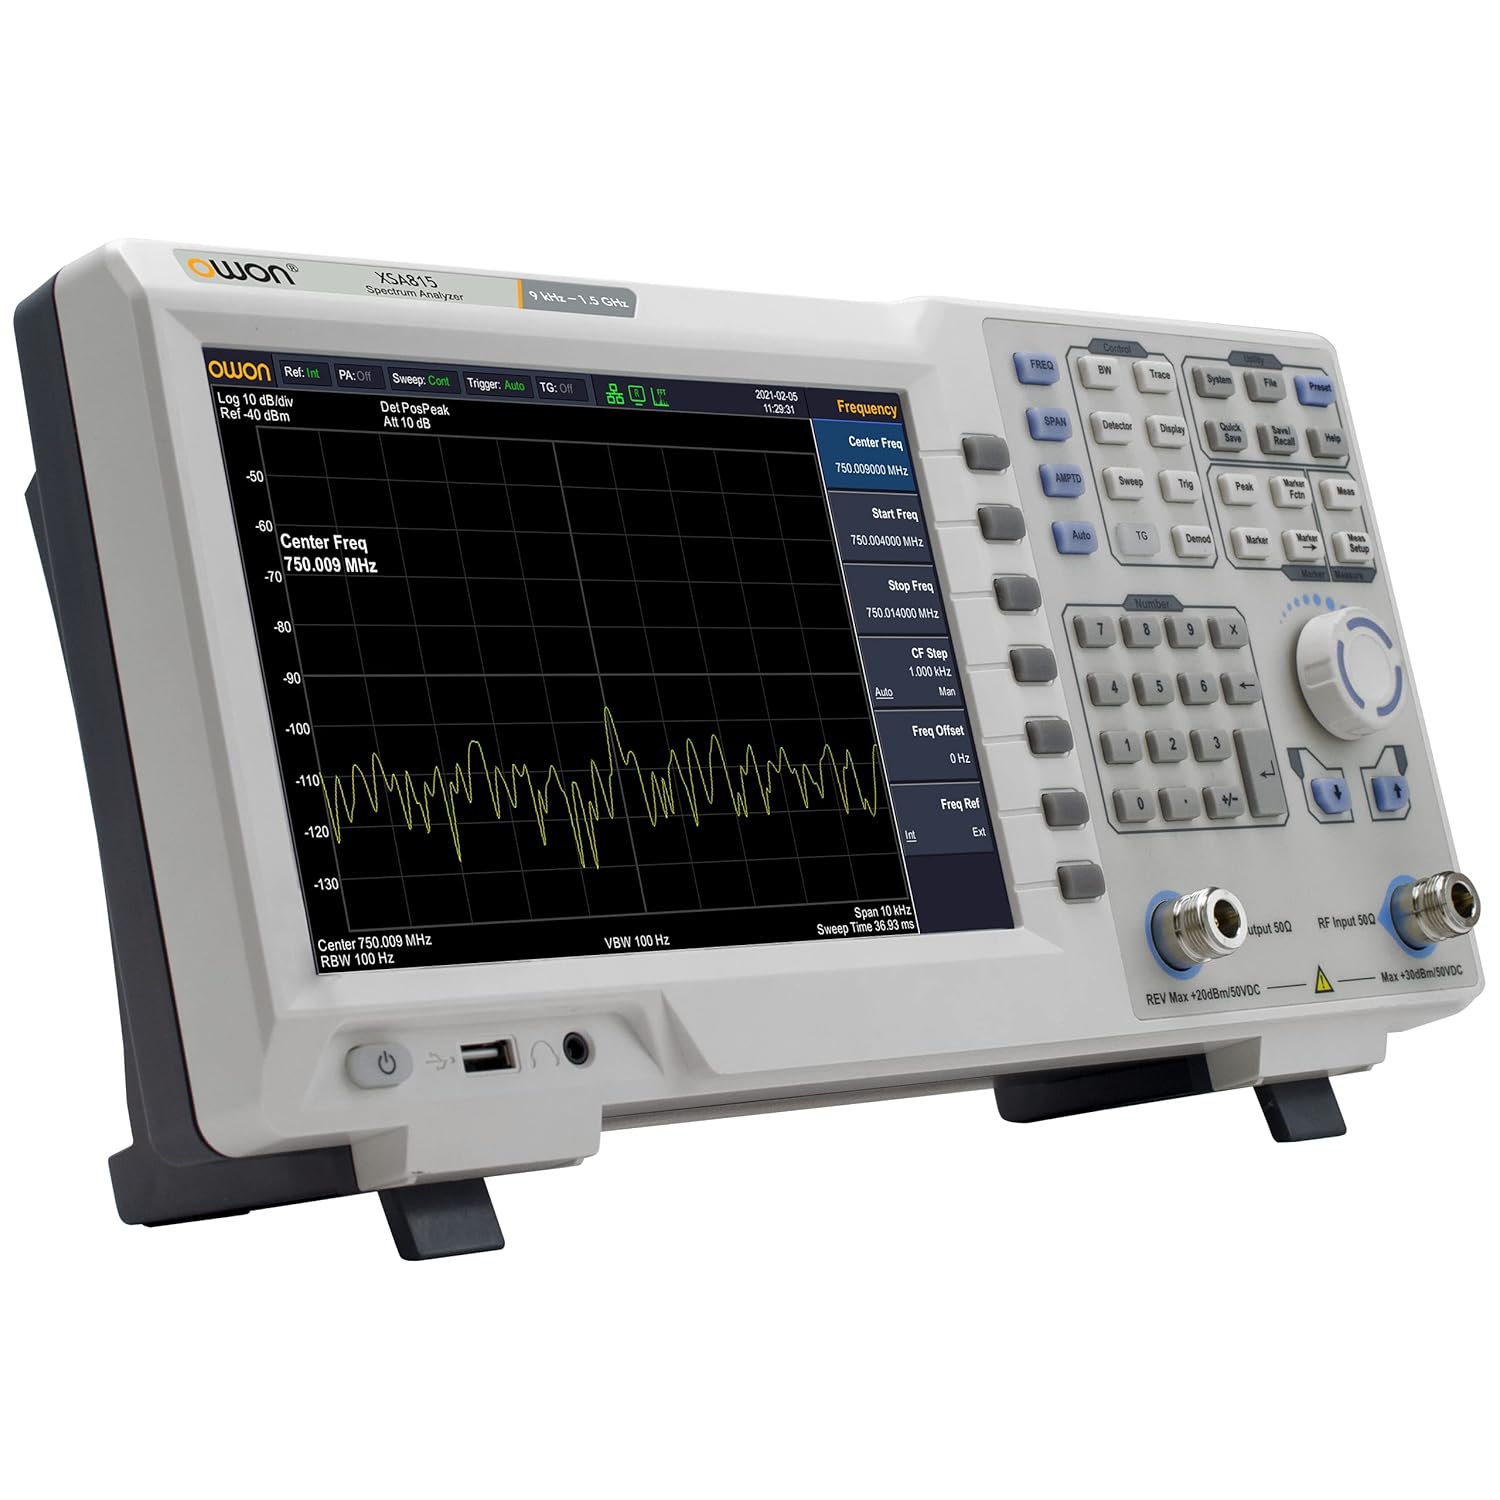
Figure 2: Angled view of the XSA815-TG, highlighting its compact design and display.
3. Operation
3.1 Front Panel Overview
The front panel of the XSA815-TG features a 9-inch LCD display with 1280x800 resolution, providing clear visualization of spectrum data. Controls include menu softkeys, function keys, a numeric keypad, a rotary knob, and arrow keys for navigation and parameter adjustment. Input and output connectors are clearly labeled.
Key interfaces on the front and rear panels include:
- Front Panel: Power key, Earphone interface, USB Host interface, Tracking generator output (optional), Numeric keypad, RF input connector.
- Rear Panel: Handle, Security lock hole, USB Device interface, Trigger input connector, Reference clock in/out, LAN interface, AC power connector.
3.2 Basic Measurement
The XSA815-TG operates across a frequency range of 9 kHz to 1.5 GHz with a 1 Hz frequency resolution. To perform a basic spectrum measurement:
- Connect the signal source to the RF input connector.
- Press the FREQ button to access frequency settings.
- Use the numeric keypad or rotary knob to set the Center Frequency, Start Frequency, and Stop Frequency.
- Adjust the Span and Resolution Bandwidth (RBW) using the SPAN and BW buttons respectively. The 1Hz minimum RBW allows for effective distinction of nearby signals.
- Observe the spectrum on the display.
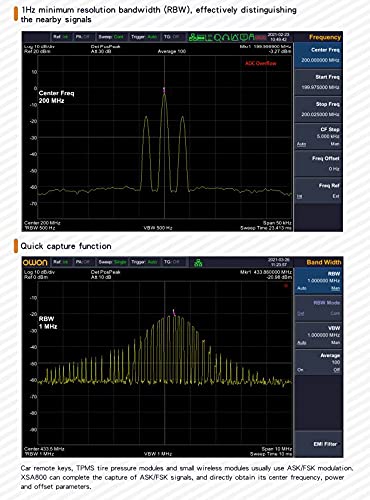
Figure 3: Display demonstrating 1Hz minimum resolution bandwidth and the quick capture function for signal analysis.
3.3 Advanced Functions
The XSA815-TG offers several advanced measurement and analysis capabilities:
- Tracking Generator (TG): Utilize the built-in tracking generator for characterization of filters, amplifiers, and other components.
- Small Signal Measurement: Capable of measuring signals down to -160 dBm DANL (Displayed Average Noise Level), enabling detection of weaker signals.
- Low-Noise Measurements: Achieves accurate measurements with phase noise typically less than -80 dBc/Hz @1GHz at 10 kHz offset.
- Pass/Fail Function: Quickly determine if test results meet predefined criteria.
- EMI Pre-compliance Test: Equipped with EMI Filter (6dB) and quasi-peak detector for pre-test and diagnosis. Supports complete testing and report generation with optional software.
- Extended Function Modes: Includes standard modulation signal quality analysis, audio demodulation, field strength measurement, channel measurement, and frequency counter.
- Waterfall Plot Graphic: View the behavior of varying signal parameters over time, track frequency and power, and identify intermittent interference signals.
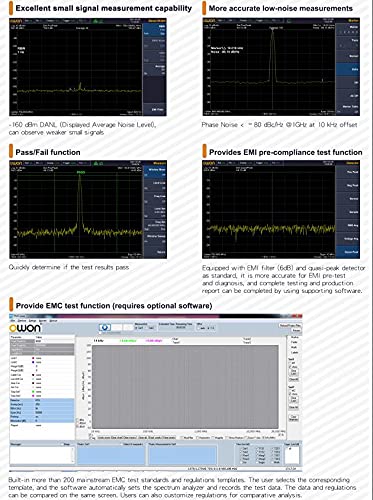
Figure 4: Examples of advanced measurement capabilities including small signal detection and EMI pre-compliance.

Figure 5: Display examples of extended functions like signal quality analysis and frequency counting.
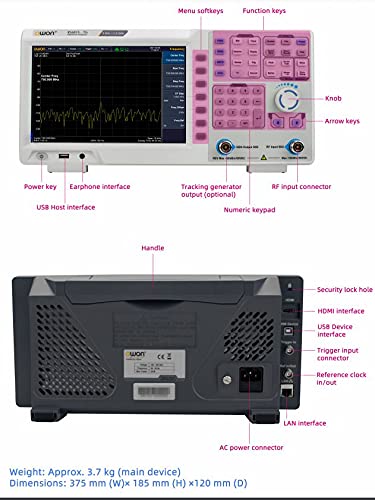
Figure 6: The Waterfall Plot graphic, useful for observing signal behavior over time.
4. Maintenance
4.1 Cleaning the Device
To maintain the performance and appearance of your XSA815-TG, regularly clean its exterior. Use a soft, damp cloth with a mild detergent. Avoid abrasive cleaners or solvents that could damage the casing or display.
Ensure the device is powered off and disconnected from the AC supply before cleaning.
4.2 Storage
When not in use for extended periods, store the spectrum analyzer in a dry, dust-free environment, away from direct sunlight and extreme temperatures. Use the original packaging or a suitable protective case for storage and transport.
5. Troubleshooting
5.1 Common Issues and Solutions
| Problem | Possible Cause | Solution |
|---|---|---|
| Device does not power on. | Power cord not connected properly; Power outlet fault; Internal fuse blown. | Check power cord connection; Test power outlet with another device; Contact support if fuse is suspected. |
| No signal displayed. | Input signal cable loose or faulty; Incorrect frequency settings; Input overload. | Verify signal cable connection; Adjust Center Frequency and Span; Check input level, reduce if necessary. |
| Display is dim or flickering. | Brightness setting too low; Environmental temperature issues; Hardware malfunction. | Adjust display brightness in system settings; Ensure operation within specified temperature range; Contact support. |
If the problem persists after attempting these solutions, please contact customer support.
6. Specifications
The following table details the technical specifications of the OWON XSA815-TG Spectrum Analyzer:
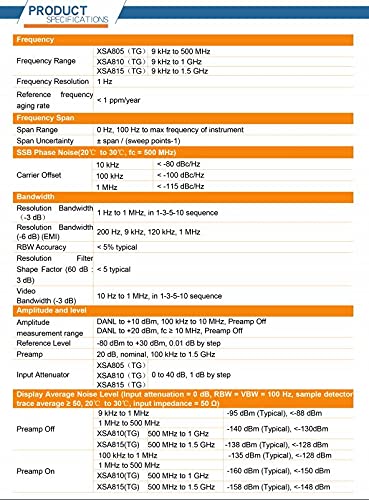
Figure 7: Detailed product specifications for the XSA815-TG.
| Parameter | Specification |
|---|---|
| Frequency Range | 9 kHz to 1.5 GHz |
| Frequency Resolution | 1 Hz |
| Display | 9-inch LCD, 1280×800 Resolution |
| Displayed Average Noise Level (DANL) | -160 dBm (typical) |
| Phase Noise | -80 dBc/Hz @1GHz and offset at 10 kHz |
| Total Amplitude Accuracy | <0.7 dB |
| Resolution Bandwidth (RBW) | 1 Hz minimum |
| Interfaces | USB Host, USB Device, LAN, Earphone, HDMI |
| Weight (Main Device) | Approx. 3.7 kg |
| Dimensions (W×H×D) | 375 mm × 185 mm × 120 mm |
7. Warranty and Support
7.1 Product Warranty
The OWON XSA815-TG Spectrum Analyzer is covered by a standard manufacturer's warranty against defects in materials and workmanship. Please refer to the warranty card included with your product for specific terms, conditions, and duration. Keep your purchase receipt as proof of purchase for warranty claims.
7.2 Customer Support
For technical assistance, troubleshooting, or service inquiries, please contact LILLIPUT customer support. You can find contact information on the official LILLIPUT website or through your authorized dealer.
When contacting support, please have your product model (XSA815-TG) and serial number ready.